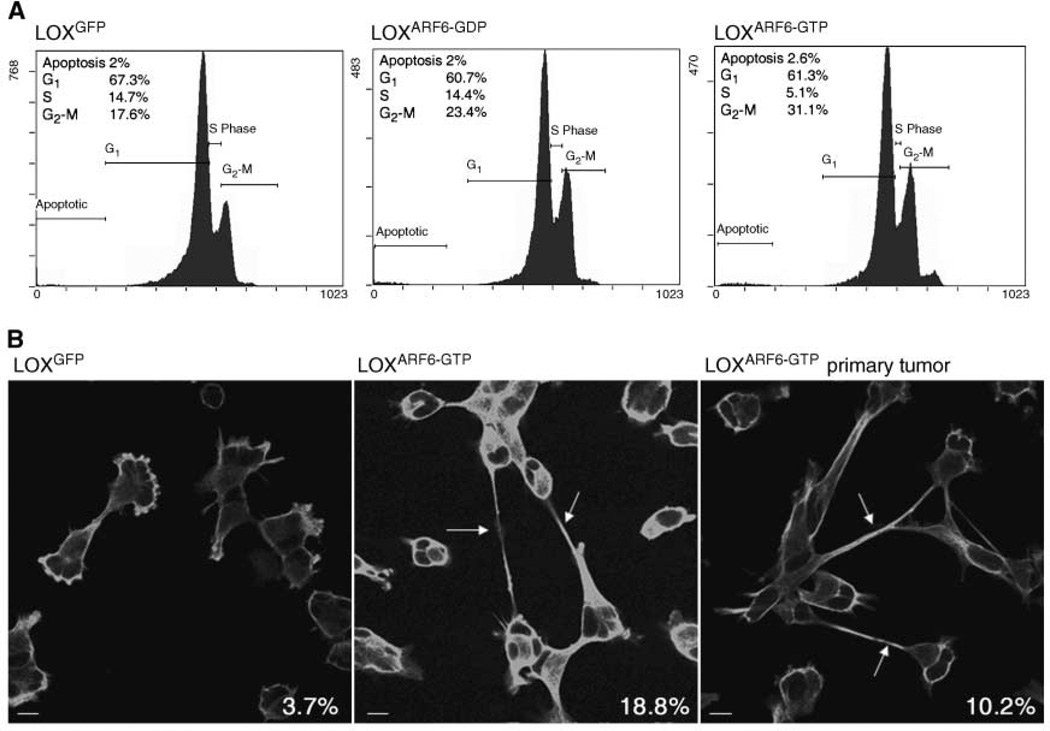
Figure 2.
Characterization of cell cycle progression. A, LOXGFP, LOXARF6-GDP, or LOXARF6-GTP cells were subjected to cell cycle analysis as described. The percentage of cells in each phase of the cell cycle is shown. B, LOXGFP, LOXARF6-GTP cell lines, and subcultured cells from the LOXARF6-GTP primary tumor were synchronized at G2-M, and progression through mitosis was monitored. Cells were fixed and stained for α-tubulin at 5 h post entry into mitosis. The percentage of cells exhibiting tubulin-positive intercellular bridges (arrows) is indicated on the bottom right of each image.

