
Figure 1.
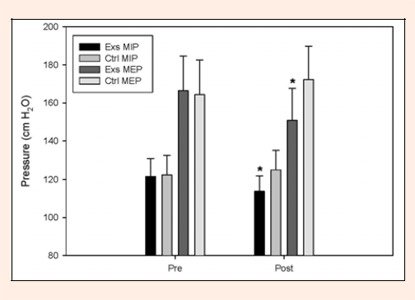
This figure shows pressures elicited during and after the exercise and control studies. Bars are according to legend * = different from Pre value.
Official websites use .gov
A
.gov website belongs to an official
government organization in the United States.
Secure .gov websites use HTTPS
A lock (
) or https:// means you've safely
connected to the .gov website. Share sensitive
information only on official, secure websites.
This figure shows pressures elicited during and after the exercise and control studies. Bars are according to legend * = different from Pre value.