
Fig. 4.
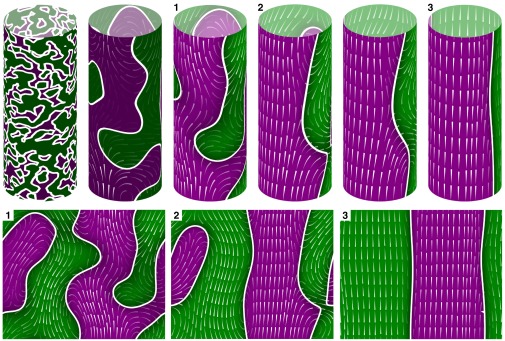
Cyclosis developing in our model for  and
and  , with other parameters fixed as in the text. Color coding corresponds to the z-component of the order vector
  , with purple for
  and green for
  , darker for lower magnitude. The white lines represent IZs separating up- and down-streaming regions. Superimposed are streamlines of the cytoplasmic flow
  induced by the filament field
  , where the flow is directed from the thin end to the thick end of the individual lines. (Upper) Time sequence of six frames, showing progression from random disorder through local order to complete steady cyclosis. (Lower) “Unwrapped” streaming patterns of the three indicated frames.