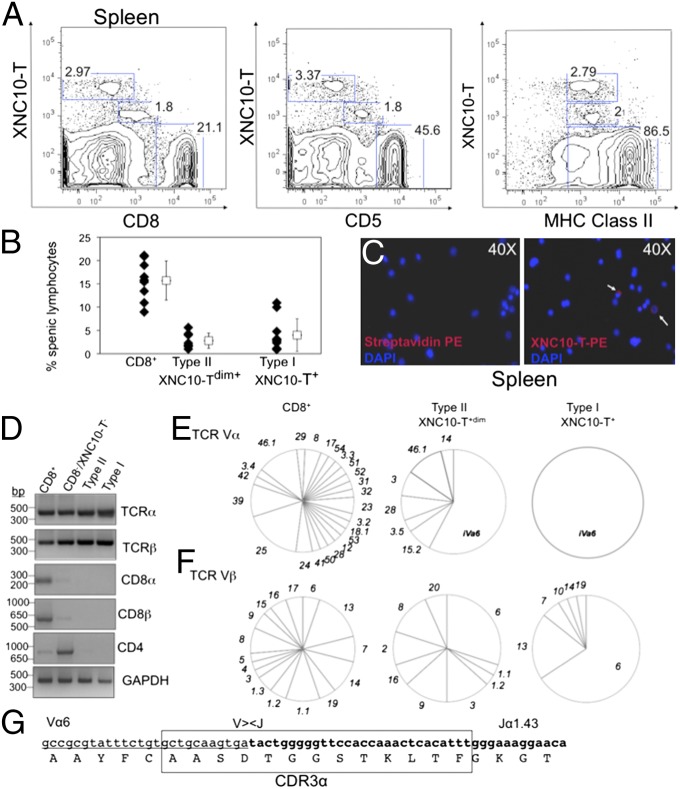
Fig. 1.
Identification of XNC10-T+ T-cell populations in the spleen of adult Xenopus. (A) Flow cytometry of live spleen leukocytes isolated from adult Xenopus and stained with XNC10-T and CD8, CD5, or MHC class II-specific mAbs. (B) Percent XNC10-Tbright+ (3.5% ± 3.5), XNC10-Tdim+ (2.5% ± 2.6), and CD8+ cells (15.76% ± 3.9) of total live spleen leukocytes (n = 10 adult outbred Xenopus; mean and SD for each population are shown). (C) Immunofluorescence using XNC10-T on adult Xenopus spleen leukocytes is shown in red; nuclei (blue) were stained with DAPI. (Magnification: 40×.) Arrows indicate XNC10-T+ cells. (D) Gene expression profiles of sorted cells from spleen leukocytes. (E and F) TCRα and -β variable segment (V) repertoire (listed by numbers) in sorted populations from inbreed J-strain X. laevis. TCR Vα, n = 35 clones sequences from each population; TCR Vβ, n = 26, 30, and 35 clones, respectively. Data shown are representative of three independent experiments. (G) Nucleotides and amino acids of the invariant CDR3α sequence. Va6 nucleotides are underlined, Jα1.43 nucleotides are bold, and the CDR3α region is boxed.

