Fig. 4.
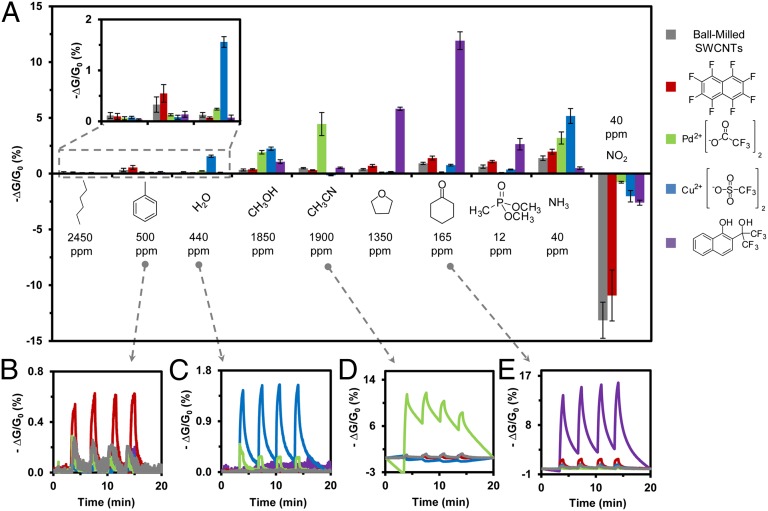
Sensing response of a cross-reactive array fabricated by mechanical abrasion of ball milled and compressed SWCNTs and composites of SWCNTs with selectors S1–S (4) with (1:4 nC/S by mass) on the surface of weighing paper. (A) Change in conductance (represented as –ΔG/G0, %) resulting from exposure of the array to eight vapors (at ∼1% equilibrium vapor pressure, specific concentrations as shown) and two gases (40 ppm each). Each bar represents the average response of three sensors exposed to each analyte in triplicate. Vertical error bars show SD from the mean based on three exposures of three sensors to each of the analytes. (B) S (2) exhibits enhanced signal toward toluene. (C) S (3) shows enhanced signal toward water vapor. (D) S (4) enhances signal toward acetonitrile. (E) S1 enhances signal toward cyclohexanone.

