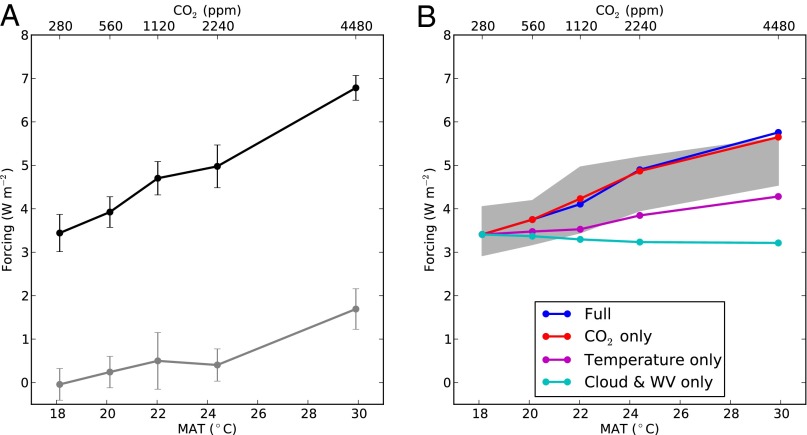
Fig. 2.
Forcing analysis for the early Paleogene simulations. (A) Radiative forcing due to a doubling of CO2 as a function of global mean surface temperature and MAT (black line) and contribution to the forcing due to ultrafast cloud adjustment (gray line). Error bars represent 95% confidence intervals. (B) Offline radiative forcing calculations using simulated climatological temperature, humidity, and cloud fields (Methods). Lines show results when all fields, as well as baseline CO2, vary (blue); when only baseline CO2 varies (red); when only temperature varies (magenta); and when only humidity and clouds vary (cyan). Gray shading shows total forcing minus the ultrafast cloud adjustment component (i.e., the difference between the black and gray lines in A). WV, water vapor.

