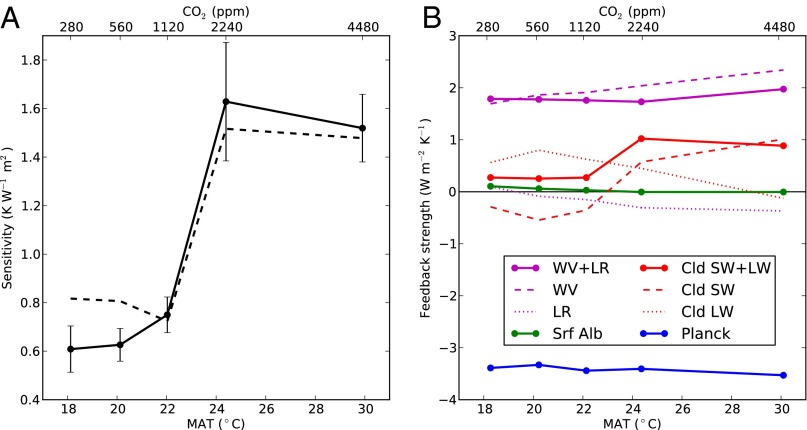
Fig. 3.
Feedback analysis for the early Paleogene simulations. (A) Specific climate sensitivity as a function of global mean surface temperature and MAT computed using the method of Gregory et al. (46) (solid line) and the PRP method (dashed line). Error bars represent 95% confidence intervals. (B) Strengths of individual feedback mechanisms as a function of global mean surface temperature and MAT: surface albedo (Alb) feedback (green line); WV feedback (dashed magenta line), lapse rate feedback (dotted magenta line), and their sum (solid magenta line); cloud short-wave (SW) feedback (dashed red line); cloud long-wave (LW) feedback (dotted red line); total cloud feedback (solid red line); and Planck feedback (blue line).

