
Fig. 3.
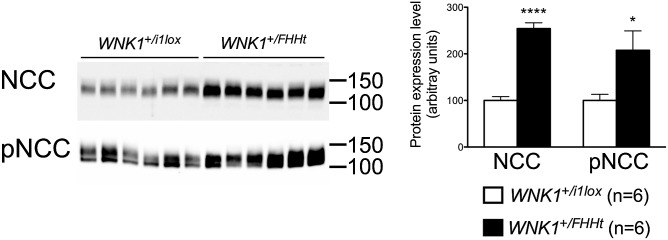
The expression, phosphorylation, and transcriptional expression of the NCC are increased in WNK1+/FHHt mice. (Left) Representative immunoblots performed on the membrane-enriched fractions of the renal cortex of control and WNK1+/FHHt males (n = 6 per group) incubated with anti-NCC and antiphospho-NCC (pNCC) antibodies. (Right) Densitometric analysis showed that the abundance and phosphorylation of NCC were significantly increased in WNK1+/FHHt mice (black bars) compared with controls (open bars). Data are mean ± SEM. *P < 0.05; ****P < 0.0001 (unpaired Student t test).