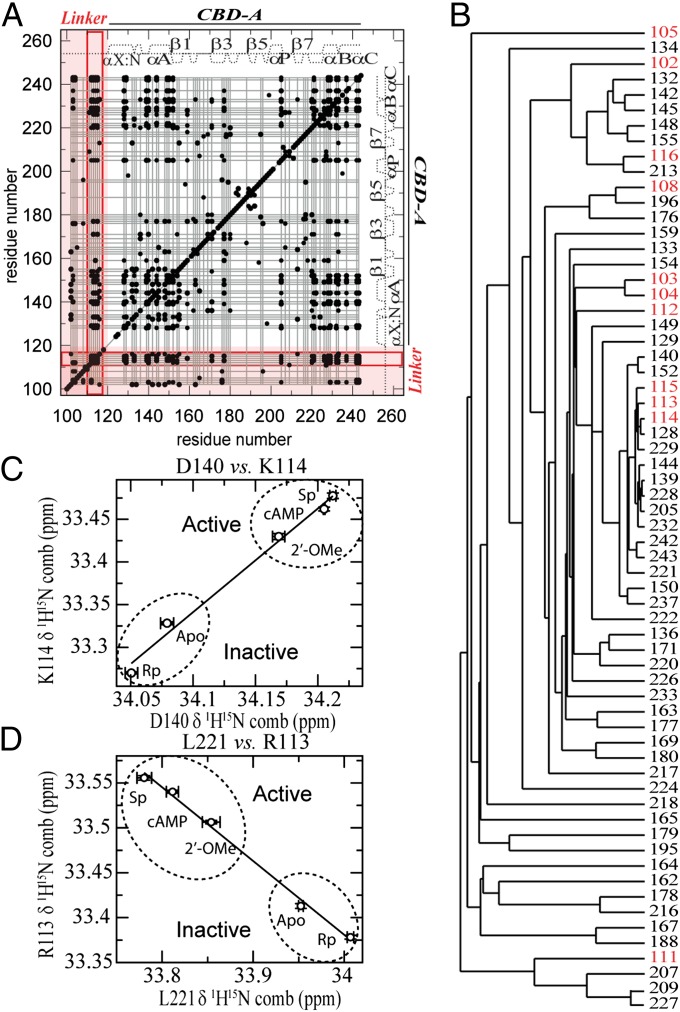
Fig. 3.
cAMP-dependent allosteric network of R reaches the linker region. (A) Chemical shift correlation matrix of RIα (91-244). Black dots identify residue pairs with absolute correlation coefficients ≥0.98. Grid lines connect residues in the largest agglomerative cluster (cluster 1). The linker region is highlighted in red. Key CBD-A/linker correlations are boxed by red lines. (B) Cluster 1 dendrogram. Residues linked through the dendrogram are labeled. Linker residues are in red. (C and D) Representative interresidue chemical shift correlations involving the linker region.

