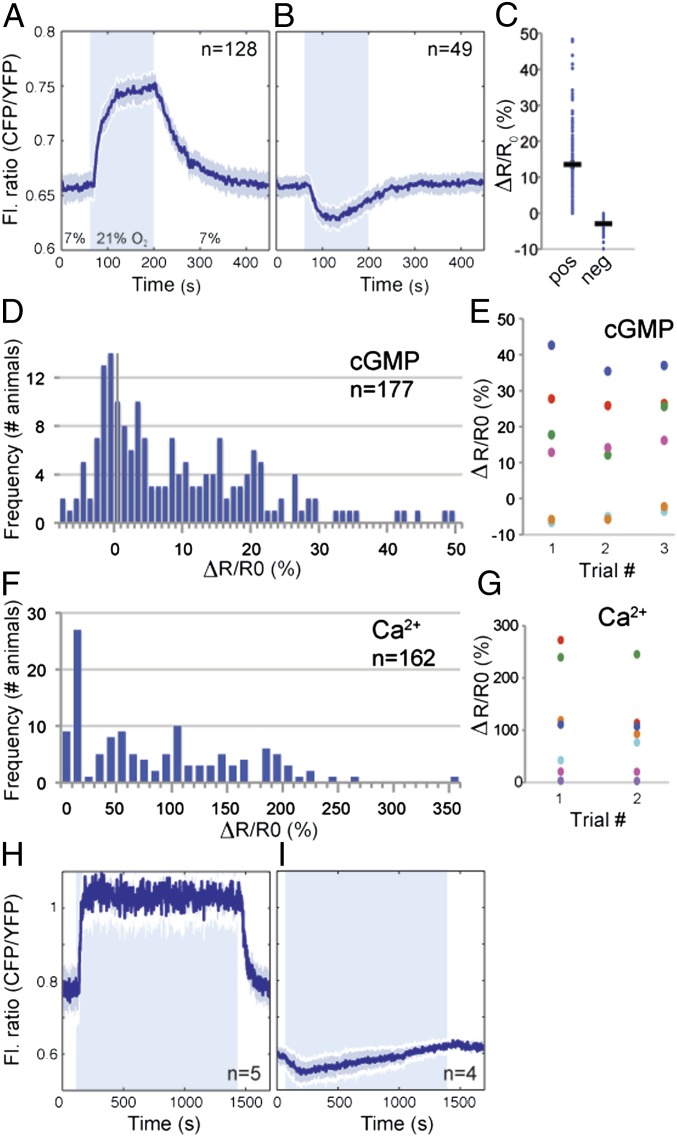
Fig. 1.
O2-evoked cGMP dynamics in PQR. (A and B) Average fluorescence ratio (CFP/YFP) changes evoked by a 7%–21%–7% O2 stimulus in PQR neurons expressing cGi500. (A) In 72% of animals, the sensor reports an increase in [cGMP] when [O2] rises to 21%. (B) In 28% of animals, it reports a decrease. In this and all figures, n = number of animals assayed, and the blue area indicates when [O2] was 21%. The solid line shows the average ratio and the shading around it the SEM. The fluorescence ratio is plotted as CFP/YFP for convenience: an increase in this ratio indicates an increase in [cGMP]. (C) Quantification of the responses in A and B. Ro is the mean fluorescence ratio at 7% O2 measured in the 30 s before the switch to 21% O2. Rf is the mean fluorescence ratio at 21% O2, measured during the last 30 s at 21%. ΔR is Rf − Ro. In this and subsequent figures, each dot indicates one recording, and black bars indicate average ΔR/Ro ± SEM. (D) Histogram showing interindividual variation in cGMP responses evoked in PQR by a 7%–21% rise in O2. The y axis is frequency of occurrence. (E) Scatter plot comparing inter- and intraindividual variation in cGMP responses evoked by repeated stimulation with a 7%–21% rise in O2. Each color represents one animal. The x axis indicates iterative stimulation. The 96.9% of the total variance is due to interindividual variation (P < 0.0001 ***); the remainder includes all other variation (two-way random effect ANOVA). (F) Histogram showing interindividual variation in Ca2+ responses evoked in PQR by a 7%–21% rise in O2. Data are from immobilized animals. (G) Scatter plot comparing inter- and intraindividual variation in Ca2+ responses evoked by repeated stimulation with a 7%–21% rise in O2 in freely moving animals. Each color represents one animal; the x axis indicates round of stimulation. The 88.5% of the total variance is due to interindividual variation (P = 0.007 **); the remainder includes all other sources of variation (two-way random effect ANOVA). (H and I) Average fluorescence ratio (CFP/YFP) traces during persistent exposure to 21% O2. Sustained high [O2] elicits tonic elevation of [cGMP] in PQR in the majority of animals (H). In a subset of individuals, cGMP levels fall and then gradually return to baseline after a switch from 7% to 21% O2 (I).

