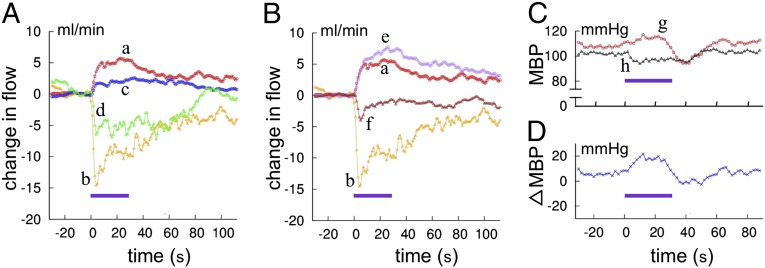
Fig. 8.
Electric foot shock-evoked changes of arterial blood flow and blood pressure. (A) Redistribution of arterial blood flow. Curves a and b indicate control FAF and VAF, and the superposed curves c and d indicate FAF and VAF following systemic administration of OX-1R antagonist. Each curve indicates an average of four trials in the same session. (B) Changes in arterial blood flow recorded in the same rabbit as that whose data are shown in A before (curves a and b, same data as in A) and 5 d after kainite injection into bilateral fp regions (curves e and f, average of six trials). (C) Changes in mean BP (MBP) evoked by foot-shock stimulation. Curve g, before kainite lesioning; curve h, after kainate lesioning. (D) Difference between the curves g and h. Horizontal bars indicate the period of foot shock stimulation.

