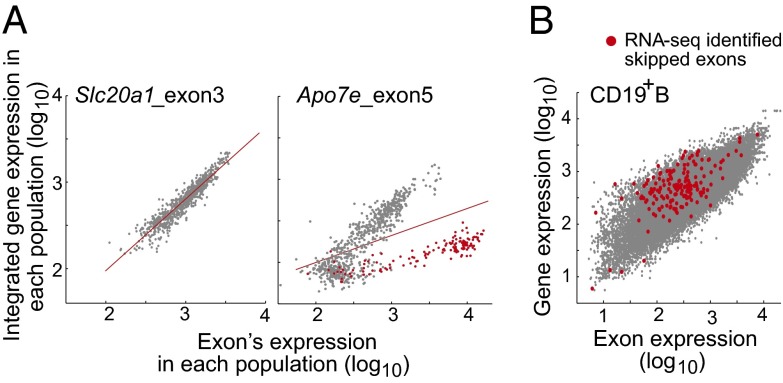
Fig. 3.
Alternative splicing revealed by feature-level analysis of ST1.0 microarray data. (A) Examples showing the expression of a single exon vs. expression of the corresponding gene across all ImmGen cell types; red highlights (Right) denote DC lineage cells. (B) Plot of every exon’s expression vs. the integrated expression of the corresponding gene in one cell type (here, CD19+ B cells). Exons found to be skipped in the RNA-seq junction data are highlighted (skipping ratio ≥ 0.5).

