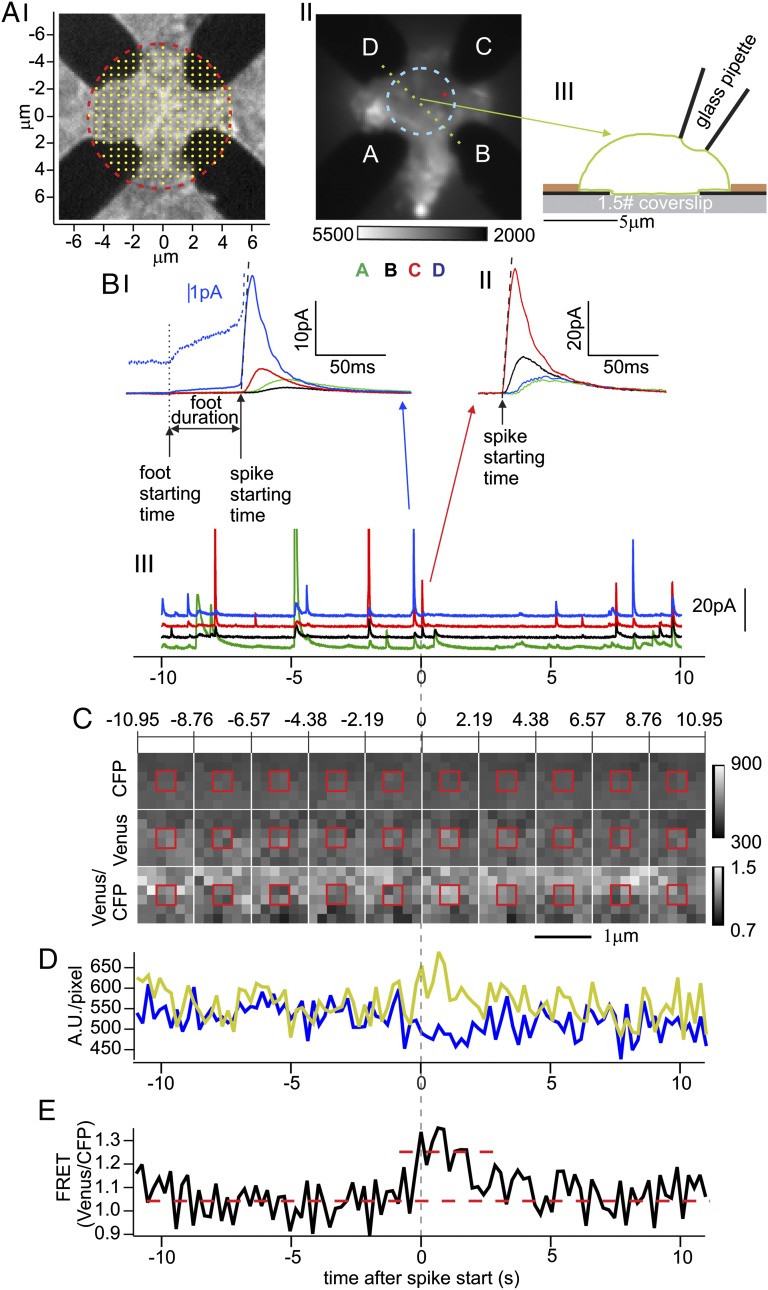
Fig. 1.
Spatiotemporal correlation of exocytic events and fluorescence changes in bovine chromaffin cells expressing SCORE. (A, I) Bright-field image of ECD array. The four Pt conductors (black) are covered by a translucent (and invisible) insulating layer that was removed in the region outlined by the red circle. Within the red circle, the tips of four electrodes are exposed for the detection of fusion events. The yellow dots on a 500-nm grid indicate the release locations that were assumed for a set of RWSs providing the expected fractions of molecules detected by the four individual electrodes for these locations. (A, II) Fluorescence footprint of a cell expressing SCORE placed on the ECD array and excited in TIR mode at 436 nm (average of 1,000 exposures without background subtraction). The ECD electrodes located between glass surface and cell membrane (labeled A–D) are dark. The average fluorescence in a circular area between the electrodes (dashed cyan) with ∼2.5-µm radius served as control for measurements at release sites. (A, III) Schematic cross-sectional view of the ECD array with the cell along the green dotted line in A, II. The heights of the ECD electrode (black) and insulation (brown) layers are 150 nm and 300 nm, respectively. (B, I–III) Amperometric currents from the cell shown in A, II recorded by the four ECD electrodes as indicated by colors. One adjacent AFS spike (B, I) and non-AFS spike (B, II) from the recording (B, III) (blue and red arrows) are shown on expanded scales. Spike starting times (upward arrows in B, I and II) are based on linear fits of the rising phase (black dashed lines, see Materials and Methods). In B, I a short upward arrow marks the foot start time and the horizontal arrow the foot duration. The blue dotted line shows the foot signal from electrode “D” on expanded scale. The fractions of molecules detected by the different electrodes for the B, II event are best matched by the RWS results for the release site marked by the small red dot in A, II. (C) Image sequence of excised six-by-six-pixel region centered at the release site. For clarity, each panel shows a 2.19-s average of 10 consecutive frames. Emission in CFP channel (Top), Venus channel (Middle), and fluorescence ratio of Venus/CFP (Bottom). (D) Time courses of CFP (blue) and Venus (yellow) channels (after background subtraction) averaged over the two-by-two-pixel region framed by the red square in C. (E) Time course of the Venus/CFP ratio (black) suggests a possible transient FRET change (red dashed lines) at the spike starting time (vertical dashed line).

