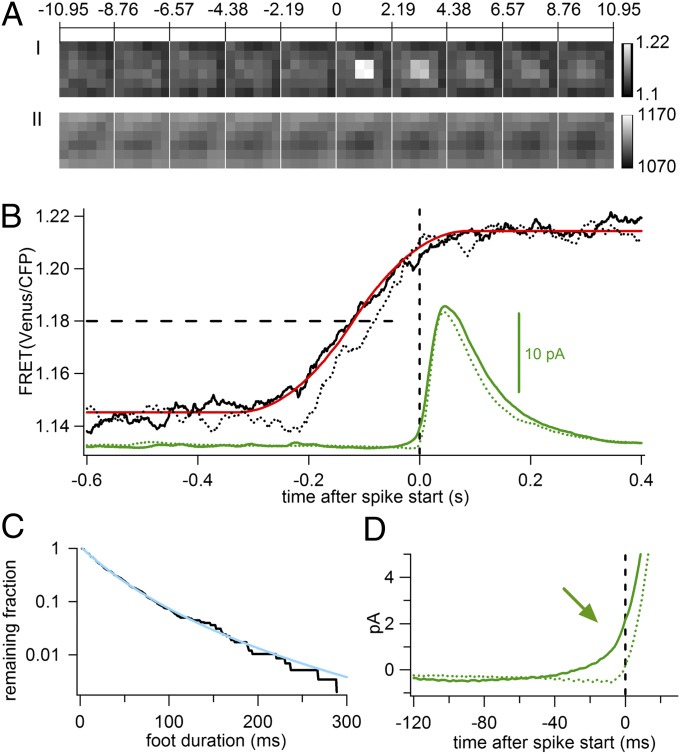
Fig. 3.
Relation of FRET change to fusion pore opening and dilation. (A, I and II) Image sequence of averaged FRET ratio (A, I) and averaged total fluorescence CFP+Venus (A, II) from 581 AFS events. (B) Time courses of FRET change from AFS (solid black line) and non-AFS (dotted black line, redrawn from Fig. 2E) events relative to spike starting times (time 0) and fit of AFS FRET trace with ECOM step response function; averaged amperometric spike of AFS (solid green line) and non-AFS (dotted green line). The horizontal dashed line indicates the 50% FRET change levels. (C) Frequency of foot durations plotted as survival curve on logarithmic scale (black line) and power-law fit (cyan line). (D) Expanded ECD traces (from B) show average foot signal (arrow) in AFS (solid green line) but not in non-AFS (dotted green line) events. Vertical dashed lines indicate spike start time.

