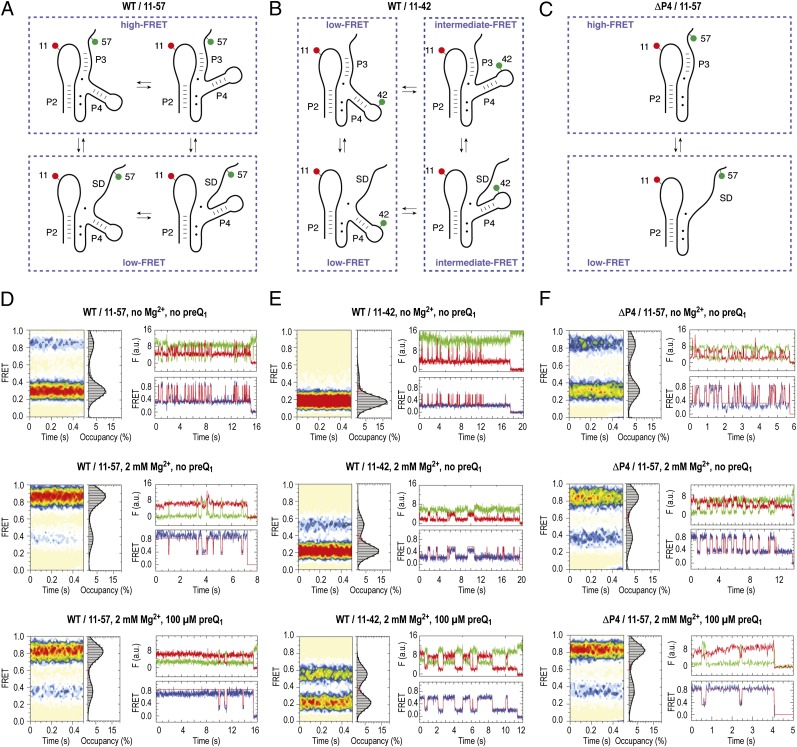
Fig. 4.
Dynamics of the preQ1 riboswitch aptamer analyzed by smFRET imaging and cartoon representations of hypothetic folding states predicted from secondary structure analysis and experimental FRET data. (A) Schematics of labeling pattern to sense pseudoknot formation. (B) Same as A but with labeling pattern to sense dynamics of the extra stem–loop P4. (C) Same as A but with labeling pattern to sense dynamics of pseudoknot formation of the ΔP4 deletion mutant. (D) Population FRET histograms showing the mean FRET values and percentage (%) occupancies of each state observed for the preQ1-II riboswitch (WT/11–57) in the absence of Mg2+ and preQ1 ligand, in the presence of 2 mM Mg2+ ions, and in the presence of 2 mM Mg2+ ions and 100 μM preQ1; corresponding fluorescence (green, Cy3; red, Cy5) and FRET (blue) trajectories of individual preQ1 aptamer molecules under the same conditions, where idealization of the data to a two-state Markov chain is shown in red. (E) Same as D but with WT/11–42 labeling scheme. (F) Same as D but with ΔP4 deletion.

