Fig. 1.
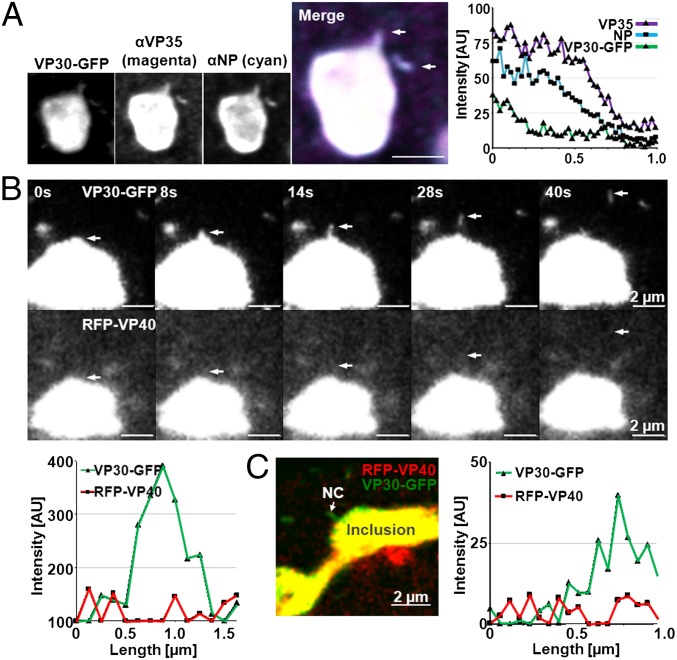
NCs in the process of leaving viral inclusions do not contain VP40. (A) Huh-7 cells transiently expressing VP30-GFP were infected with MARV, fixed at 24 h p.i., and analyzed by confocal microscopy using monoclonal α-NP and guinea pig α-VP35 followed by goat α-mouse antibodies coupled to Alexa Fluor 647 and goat α-guinea pig antibodies coupled to Alexa Fluor 594. In addition, autofluorescence of VP30-GFP was recorded. A fluorescence intensity profile along the length axis of the emanating NC is displayed (diagram). (Scale bar, 2 μm.) (B) Huh-7 cells transiently expressing VP30-GFP were infected with rMARVRFP-VP40, and fluorescence signals were analyzed by time-lapse microscopy at 29 h p.i. Time between each frame: 3 s. The time in seconds is displayed in the upper left corner of each panel. Released NC is indicated by arrows. A fluorescence intensity profile along the length axis of the emanating NC in the panel (40 s) is displayed (diagram). (C) Huh-7 cells were treated as in B but fixed at 24 h p.i., and autofluorescence was analyzed by confocal microscopy. A fluorescence intensity profile along the length axis of the emanating NC is displayed (diagram).

