Fig. 2.
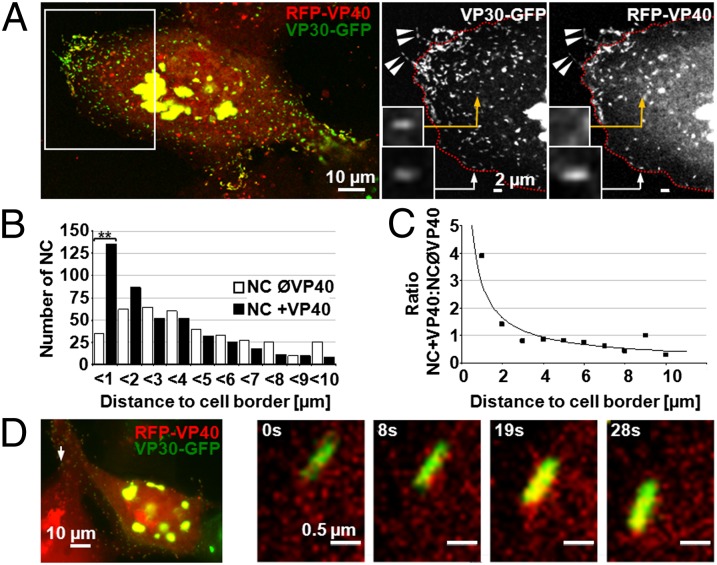
NCs become associated with VP40 close to the plasma membrane. Huh-7 cells transiently expressing VP30-GFP were infected with rMARVRFP-VP40 and analyzed by confocal microscopy (A–C) or time-lapse microscopy (D). (A) NCs associated with VP40 located in filopodia are indicated by arrowheads. VP40-positive NCs, not yet recruited into filopodia (Insets), are indicated by arrows. NC without RFP-VP40 is indicated by yellow arrows. Magnified images of the boxed region (Left) are depicted in the black and white pictures. The red dotted lines indicate the cell border; fluorescence signals outside the cell border reflect filopodia-associated NCs. (B) VP40-associated NCs are more frequently detected close to the cell border than in the cell body. NCs (VP30-GFP signals, n > 400) were analyzed for their association with RFP-VP40 and distance to the cell border at 24 h p.i. **P ≤ 0.001. (C) Quantitative analysis of the ratio of VP40-associated NCs (RFP-VP40 and VP30-GFP signals colocalized) and free NCs (only VP30-GFP signal) with respect to their distance to the cell border. (D) NC in the process of becoming associated with VP40. Time-lapse microscopy of Huh-7 cells infected with rMARVRFP-VP40 at 22 h p.i. The arrow points to the NC at the cell margins, which is magnified in the four pictures to the right.

