
Fig. 1.
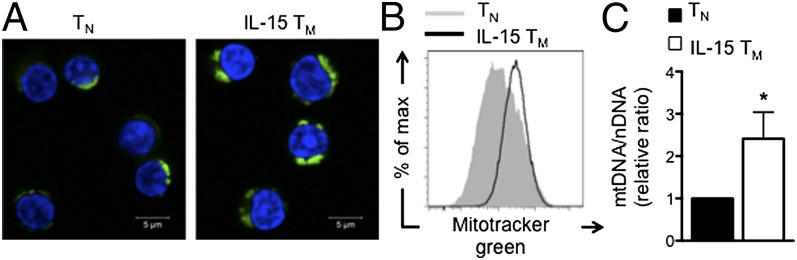
IL-15 TM cells have more mitochondrial mass than TN cells. OT-I cells were activated with OVA peptide for 3 d in IL-2 and cultured in IL-15 for 3–4 d to generate IL-15 TM cells, which were compared with OT-I TN cells. (A) TN and IL-15 TM cells stained with Mitotracker green (green) and DRAQ5 (blue). (B) Mitotracker green staining was quantified by flow cytometry. Data are representative of three experiments. (C) mtDNA/nDNA ratio, mean ± SEM, from six experiments; *P < 0.05.