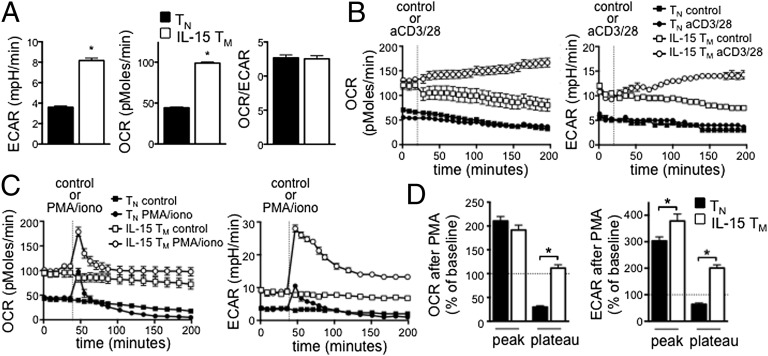
Fig. 4.
IL-15 TM cells have enhanced glycolytic capacity compared with TN cells after activation. (A) Basal ECAR and OCR were measured in OT-I TN and IL-15 TM cells; *P < 0.0001. TN and IL-15 TM cells were stimulated with anti-CD3/28 beads (B) or with PMA/iono (C) and OCR and ECAR measured. Data in A–C are from the same experiment and are representative of ≥3 experiments. (D) Compiled and baselined data as shown in C, from two experiments; peak is first measurement after PMA/iono, plateau is at 120 min. *P < 0.0001 (Left), and < 0.05 and < 0.001 (Right); mean ± SEM.

