Fig. 4.
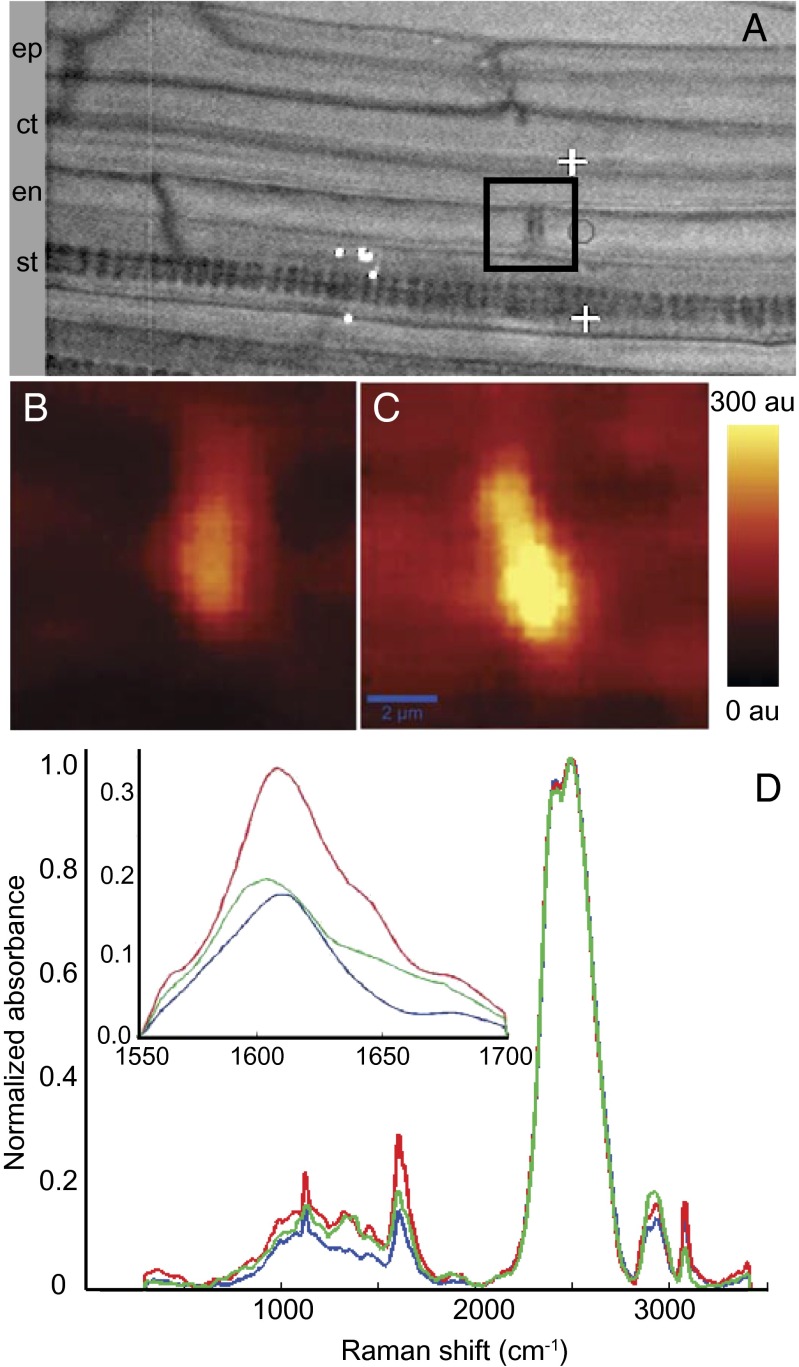
Chemical imaging using Raman confocal microscope showing increased deposition of lignin at the disrupted Casparian strip in esb1-1 mutant. (A) Representative image showing an endodermal cell junction used for acquiring 2D Raman spectra (marked with a black square box signifying a 10 × 10 µm2 area). Raman images showing the modification of lignin deposition at the Casparian strip were obtained by integrating absorption intensities between 1,550 and 1,700 cm−1 in wild-type (B) and esb1-1 (C). (D) Raman spectra extracted from the wild-type Casparian strip (blue), wild-type xylem (green), and esb1-1 Casparian strip (red). D Insert shows the lignin spectra (1,550–1,700 cm−1). Intensities were normalized to the peak height of D2O at ∼2,500 cm−1, representing the O-D stretching band intensity. au, arbitrary units; ct, cortex; en, endodermis; ep, epidermis; st, stele.

