
Figure 2.
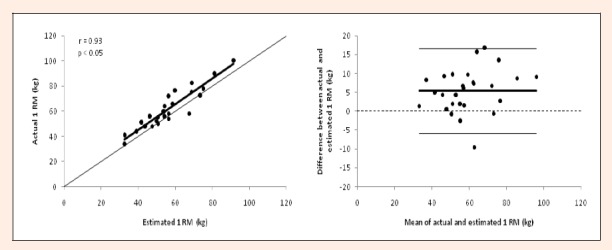
Left panel: association between actual and estimated bench press 1 RM. The dashed line is the line of identity. Right panel: Bland and Altman plots for the comparison between actual and estimated bench press 1 RM. Thick line is the bias, thin lines are the 95% limits of agreement and dashed line is the null bias.