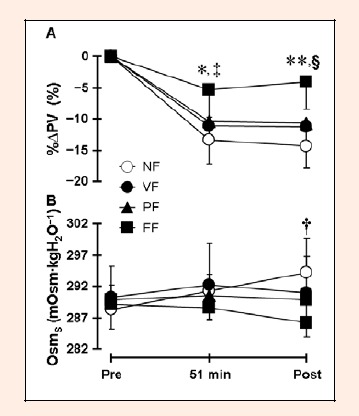
Figure 2.

Percentage change in plasma volume (%∆PV; A) and serum osmolality (OsmS; B) during exercise. Values are mean ± SD for 7 subjects. * p < 0.05 and ** p < 0.01 denotes a significant difference between the FF and other trials. † p < 0.05 denotes a significant difference between the NF and FF trials. ‡ p < 0.01 denotes a significant difference from pre-exercise in all trials. § p < 0.01 denotes a significant difference from pre-exercise in the NF, VF, and PF trials.
