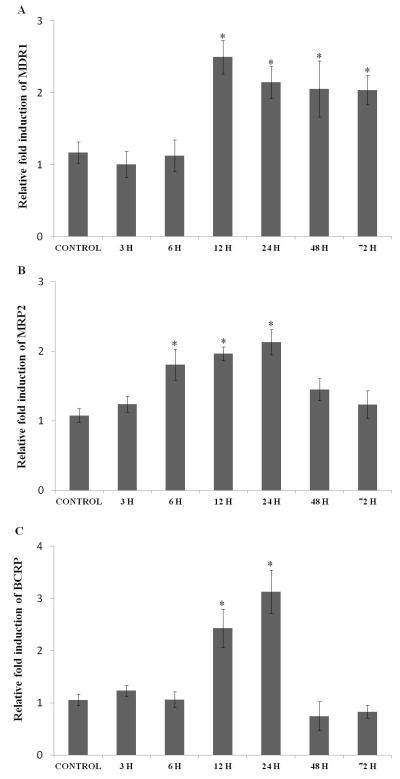
Fig. 1.
Relative fold RNA expression of various efflux transporters (A) MDR1, (B) MRP2, and (C) BCRP in D407 cells exposed to hypoxic conditions for various time points (3, 6, 12, 24, 48 and 72 hours). Values are represented as mean ± SD (n=4). A P-value of less than 0.05 was considered to be statistically significant and represented by *.

