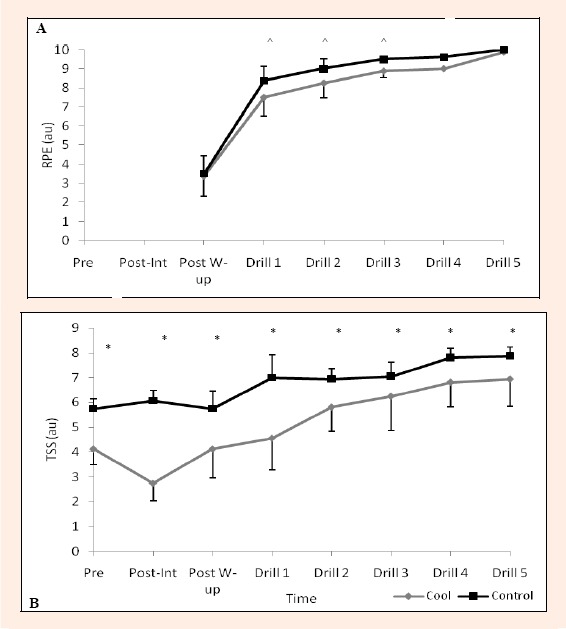
Figure 5.

Mean ± SD A) Rate of Perceived Exertion (RPE) and B) Thermal Sensation Scale (TSS) during the tennis-specific on-court conditioning session with and without pre-cooling. ^ represents a large effect size compared to cooling condition (d>1.0). * represents a significant difference compared to cooling condition (p < 0.05)
