
Figure 7.
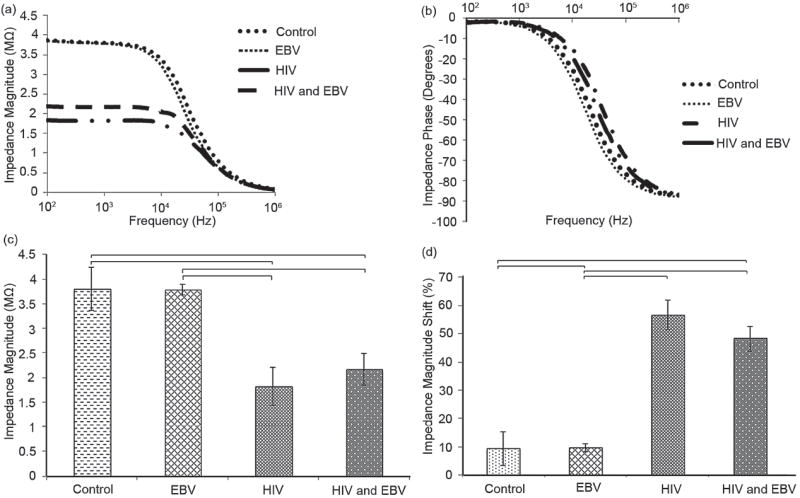
Specificity evaluation of the electrical sensing platform. Average impedance magnitude (a) and phase (b) spectra over a range of frequencies between 100 Hz and 1MHz for HIV-1 subtype B, EBV, and the mixture of HIV-1 and EBV. Control samples were prepared by mixing streptavidin-coated magnetic beads conjugated with anti-gp120 antibodies in DPBS without viruses. (c) Impedance magnitude of the samples at 1,000 Hz and 1 V. (d) Evaluation of impedance magnitude change caused by lysed HIV-1 subtype B, EBV, and mixture of HIV-1 and EBV. Impedance magnitude measured at 1,000 Hz and 1 V. The impedance magnitude shift of samples after viral lysis was normalized with respect to the impedance magnitude of the control samples. Statistical significance threshold was set at 0.05, p<0.05. The viral loads of HIV-1 subtype B and EBV were 1.2 × 10⁸ and 1.9 × 10⁸ copies/mL, respectively. The viral load of sample with mixture of HIV and EBV was 1.6 × 10⁸ copies/mL. Error bars represent standard error of the mean (n = 3). Brackets connecting individual groups indicate statistically significant impedance magnitude and impedance magnitude shift.