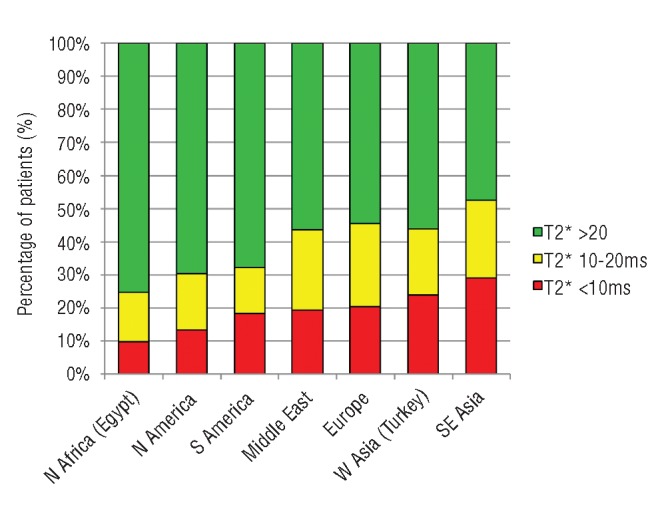
Figure 1.

Myocardial iron loading by region. Percentage of patients with myocardial T2* values <10ms (red), between 10 and 20ms (yellow) and >20ms (green) at baseline scan. Data are presented in Table 2 with regions in order of increasing percentage of iron loading (T2* <20ms).
