Figure 2.

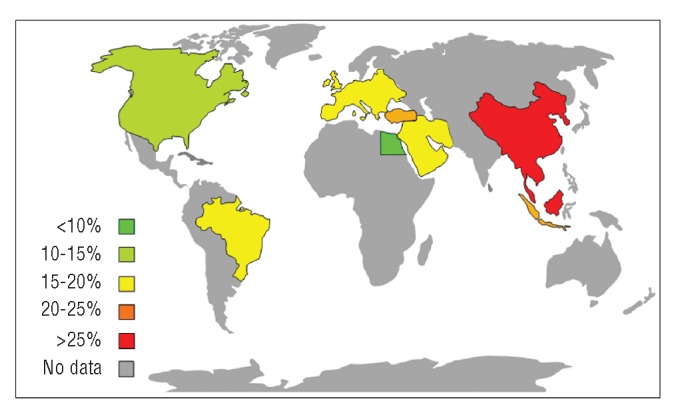
World map showing the distribution of the prevalence of severe myocardial iron loading at first CMR scan. The color scale represents the percentage of patients in each region who have severe myocardial iron loading with T2* values <10ms.

World map showing the distribution of the prevalence of severe myocardial iron loading at first CMR scan. The color scale represents the percentage of patients in each region who have severe myocardial iron loading with T2* values <10ms.