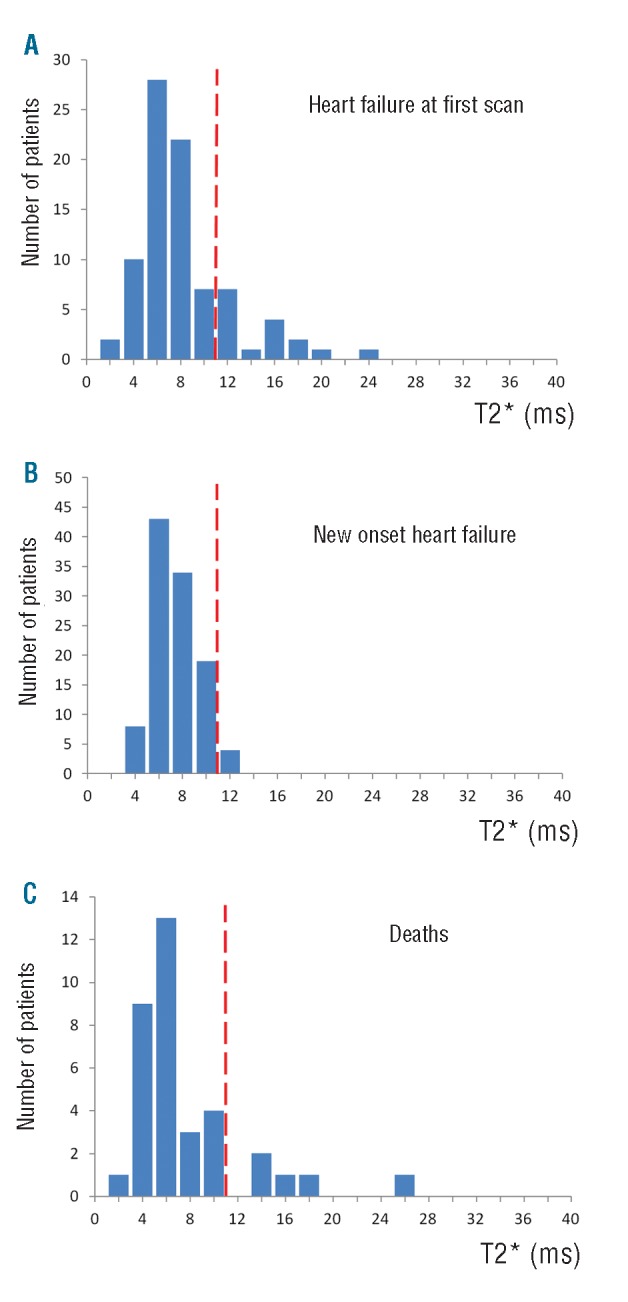
Figure 3.

Histograms of the distribution of T2* values. The broken red line represents a T2* value of 10ms. A. Myocardial T2* values for patients with heart failure at first scan. B. Myocardial T2* values for patients who developed new onset heart failure subsequent to their initial CMR scan. C. Myocardial T2* values for patients who died of cardiovascular causes subsequent to their initial CMR scan.
