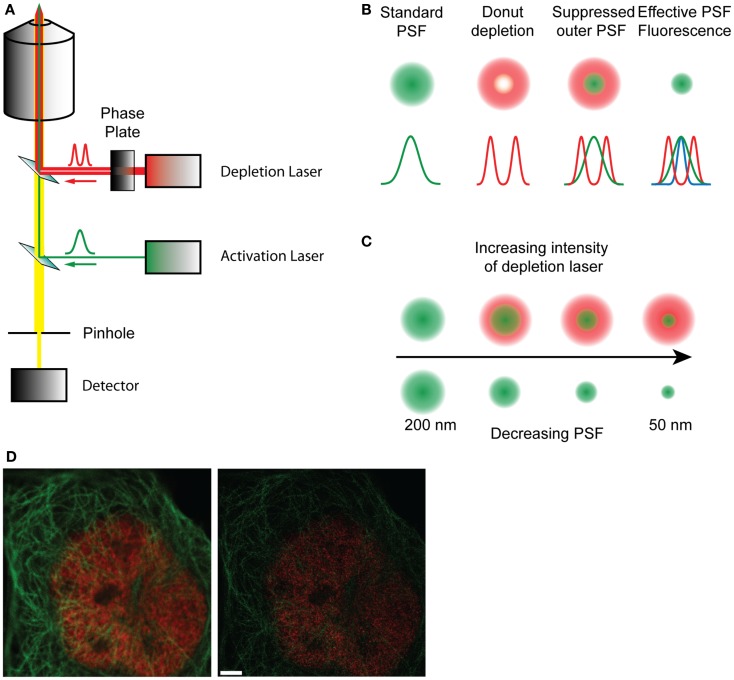
Figure 2.
(A) Schematic diagram of a STED microscope setup. The activation laser is overlaid with the depletion laser that passes through a phase plate, and focused to a focal point in the sample. The fluorescence emitted by the sample passes through a pinhole and is collected in the detector. (B) Representation of how the effective point spread function is formed by the overlap of the standard PSF and the depletion PSF. (C) With increasing intensity of the depletion laser the shape of the donut changes, decreasing the size of the inner ring and therefore reducing the effective PSF of the fluorophore from 200 nm to about 50 nm, effectively increasing resolution. (D) A raw confocal (left) and STED image (right) showing the improvement in detail and resolution. Red stain – nuclear pores, green stain – microtubules. Scale bar, 500 nm.

