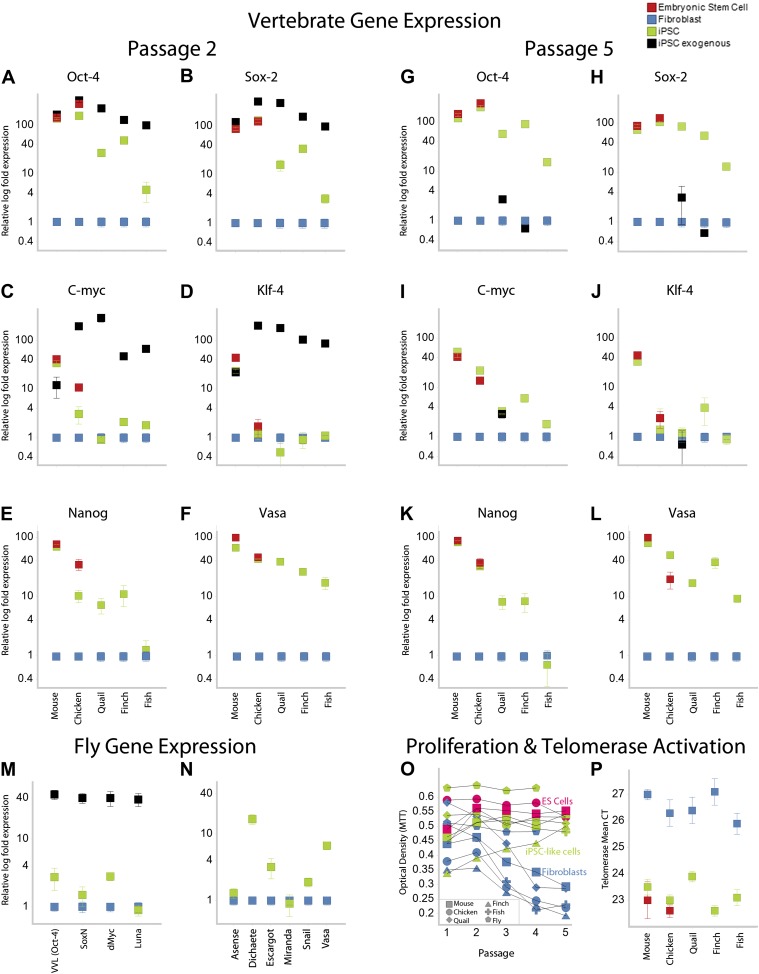
Figure 3. Upregulation of stem cell genes in mouse, birds, fish, and Drosophila by mouse transcription factors.
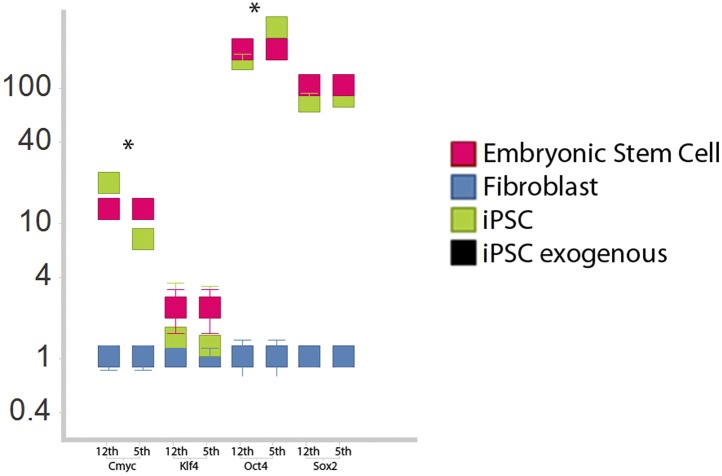
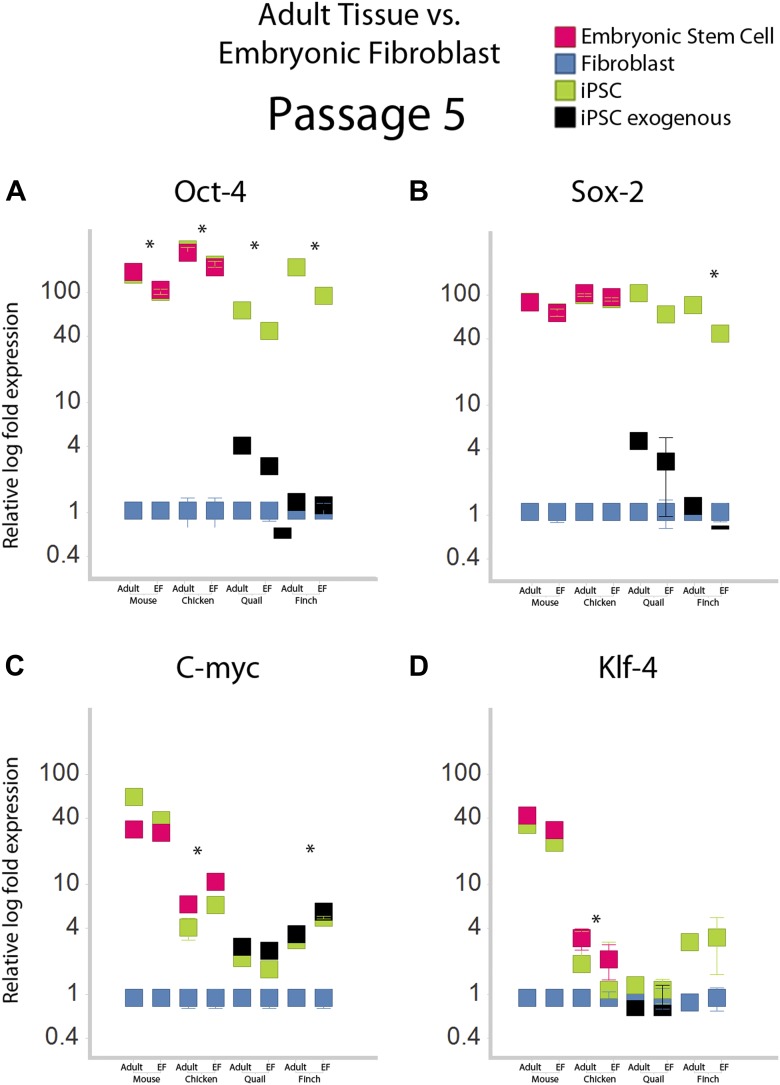
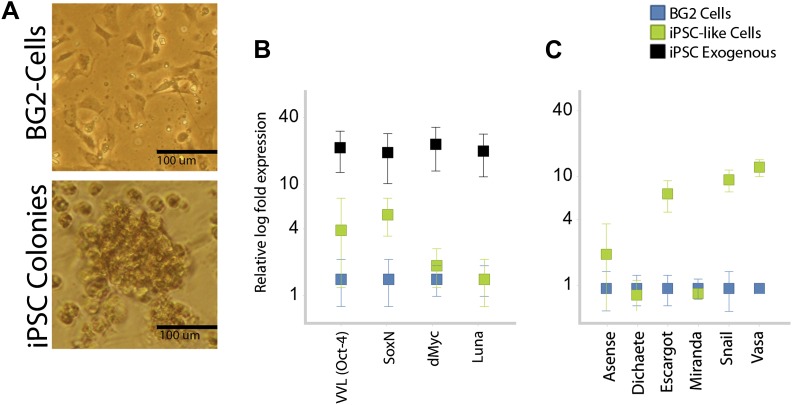
(A–D) qRT-PCR of exogenous (black) mouse and endogenous (green) species-specific expression of Oct-4 (A), Sox-2 (B), c-myc (C), and Klf-4 (D) in iPSC-like cells of each species after the second passage relative to (normalized) non-transduced fibroblast controls (blue). Mouse and chicken ESCs were included as positive controls (red). Primers used are shown in Supplementary file 1C. Several values overlap among cell types (e.g., mouse exogenous and endogenous Oct-4 and Klf-4) and are thus not distinguishable in the graph. (E–F) qRT-PCR of Nanog (E) and Vasa (F) homologs in the different cell types across species. (G–L) qRT-PCR after the fifth passage show that the exogenous mouse genes are significantly downregulated or silenced. These values were normalized to the same fibroblast values as in the second passage. Nanog and Vasa expression levels exhibit no significant difference from passage two levels, except in chicken cells. Expression levels were also measured for 12th passage iPSC-like cells (Figure 3—figure supplement 1) and fifth passage iPSC-like cells were normalized against adult tissue (Figure 3—figure supplement 2). (M) qRT-PCR of exogenous and endogenous (homologs) Drosophila specific genes in the transformed S2 cells, and N, other genes known to be involved in early embryogenesis in Drosophila. Expression levels were also measured with iPSC-like cells generated from a primary drosophila cell line (BG2; Figure 3—figure supplement 3). Error bars, S.E.M within cell populations. p-values for all comparisons are shown in Supplementary file 1D, ANOVA, (Tukey’s post hoc, p<0.001; n = 5 replicates of independent transformed lines). (O) Time course of self-renewal and proliferation of stem cells (iPSC-like cells and ESCs) relative to control fibroblast (or S2) as measured by the MTT [(3-(4,5-Dimethylthiazol-2-yl)-2,5-diphenilytetrazolium bromide] assay (read at 570 nm) (error bars not shown for clarity). ESCs and iPSC-like cells maintain high proliferation levels, while primary fibroblasts decay. (P) Telomerase activity was greatly increased (lower mean Cycle Threshold, CT) in iPSC-like cells and control ESCs over control fibroblast cells. Error bars, S.E.M (n = 5 independent cell line replicates for both MTT and telomerase data). Statistics shown in Supplementary file 1D.


