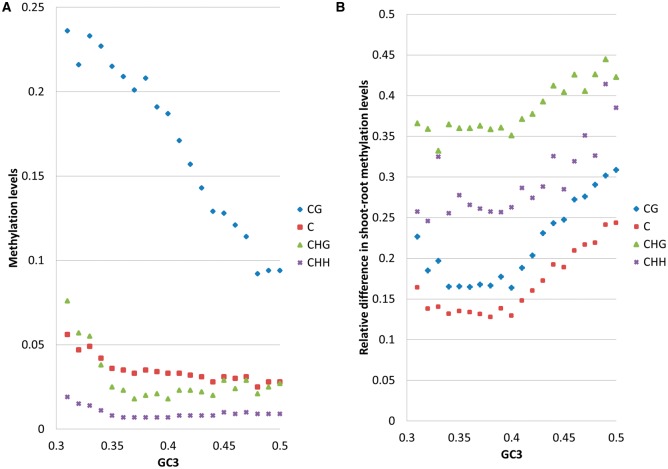
Fig. 4.—
Arabidopsis thaliana: Methylation level in Arabidopsis as a function of GC3 (A) and differential methylation between shoots and roots (B). Blue diamond: CG; red square: C; green triangle: CHG; violet cross: CHH. Every point represents an average across 100 or more genes. The absolute relative difference is calculated as  . Standard error of the mean does not exceed 0.05 for the mean methylation levels calculation.

