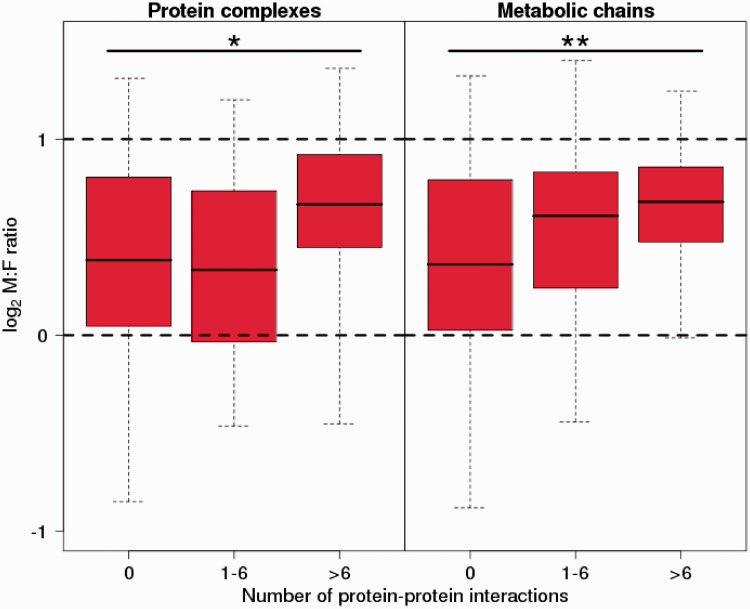
Fig. 4.—
Male-to-female expression ratio of Z-linked flycatcher genes averaged over seven nonreproductive tissues. Genes are divided into three categories according to their involvement in protein–protein interactions: 0, 1–6, and >6 interactions partners, respectively. Error bars show 95% confidence intervals for the distribution. The dashed lines indicate 2-fold excess of male expression (log2 = 1) and equal levels of expression between males and females (log2 = 0), respectively.

