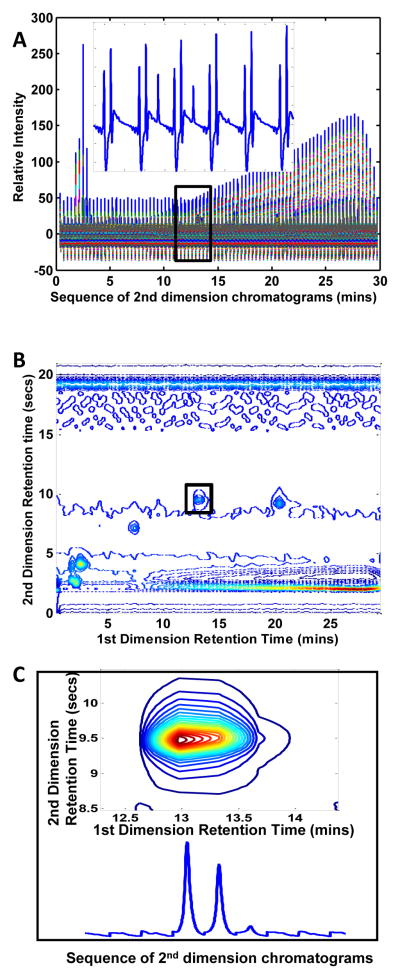
Figure 1.
Several different types of plots for the 2nd sample of the standards mixture raw data. (A) Plot of the two-way raw data as collected by the instrument, such that all 2nd dimension injections of a corresponding sample injection are sequenced end-to-end. The insert shows an enlarged section of the sequenced data that was determined to encompass the corresponding peak illustrated in the contour plot at 216 nm of (B). Using the determined section dimensions, the same peak is shown as a contour plot at 216 nm in the box (C) along with its corresponding sequenced 2nd dimension chromatograms.

