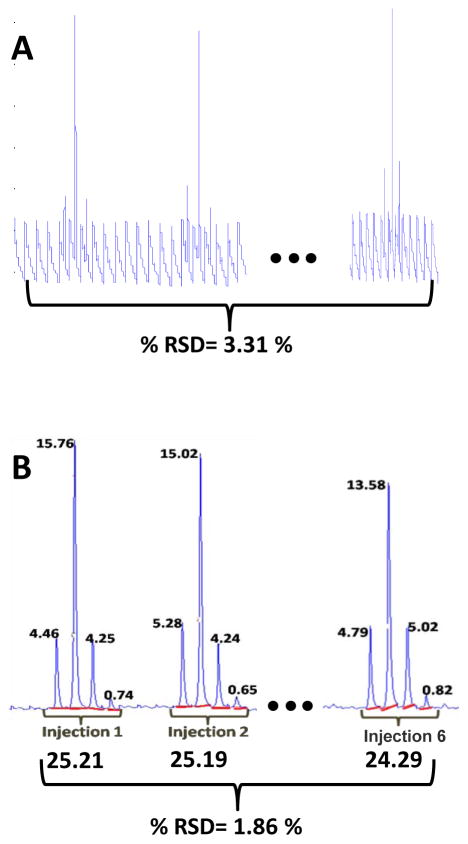
Figure 3.
Comparison of the subsection for the standards mixture peak 1 showing the sequence of resolved 2nd dimension chromatograms and the raw data for the injection of six replicate samples onto the 1st dimension column. (A) A plot of the sequenced second dimension chromatograms of the raw data. Each 1st dimension sample injection gives rise to seven 2nd dimension injections with four of those injections containing the peak of interest and three injections consisting only of the background in this example. (B) The above data after the application of the devoloped chemometric method. The red line drawn under each 2nd dimension peak shows the manually determined baseline, and the areas for each of the second dimension peaks (shown at the top of the peaks) are totaled (shown at the bottom of each peak grouping), giving the relative concentrations of peak 1 for each of the six sample injections and the % RSD showing the precision of the quantification.

