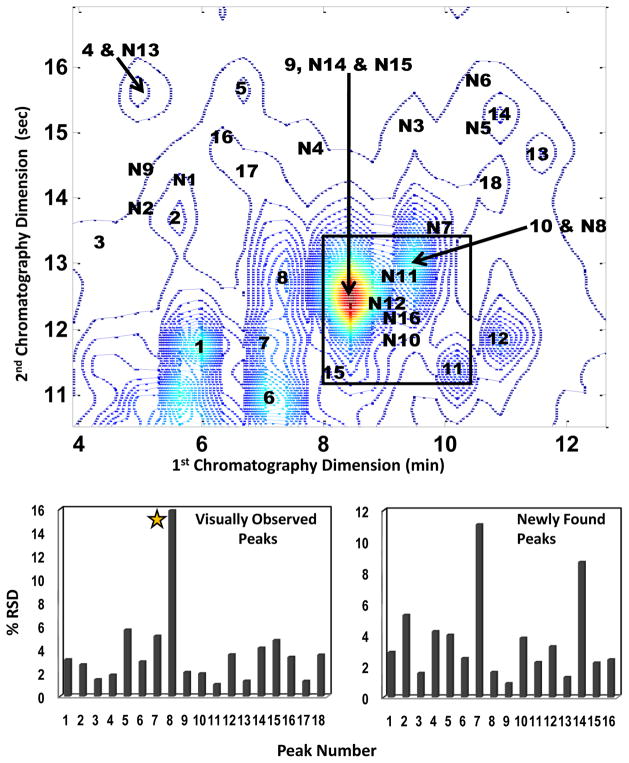
Figure 6.
Contour plot of the urine control at 216 nm showing 34 resolved peaks. The N preceding 16 of the 34 resolved and quantified peaks signifies that those peaks were found and resolved only after application of the developed chemometric method (newly found) while the other 18 peaks were visually observable prior to chemometric analysis. The two bar graphs show % RSD values calculated for the corresponding peaks. The star on the visually observed peaks graph indicates that Peak 8 is considered to be a chemically unstable compound.

