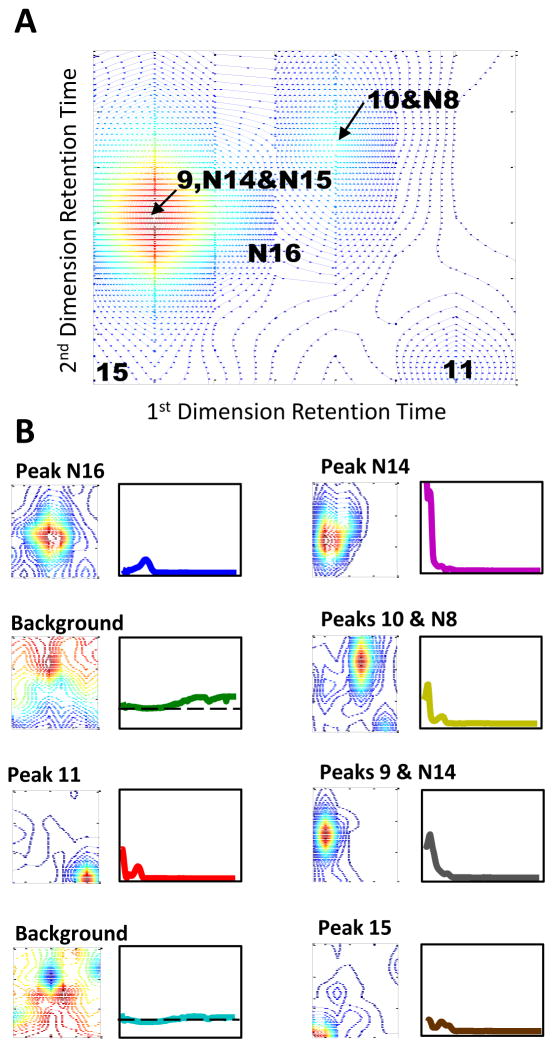
Figure 7.
(A) Contour plot of a subsection of urine control data at 216 nm in which resolution and quantification of Peak N16 is the goal for the chemometric analysis. (B) The chromatographic and corresponding spectral results for each component of the 8 component IKSFA-ALS-ssel analysisl for the above subsection of raw data.

