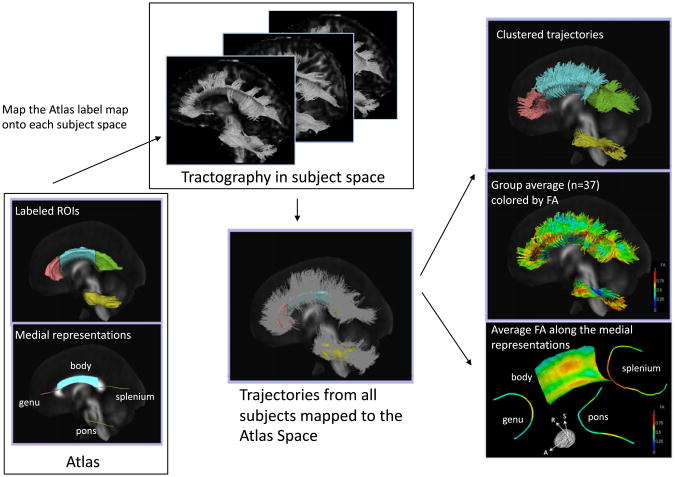
Fig. 1.
Pipeline for DTI-based fiber tract-driven topographic mapping (FTTM) analysis. Left panel: (Bottom) Labeled ROIs in the ICBM-DTI-81 atlas and the derived initial medial representation of each bundle. Middle panel: (Top) The ROIs are mapped to each subject space by applying the affine transformation obtained by registering the FA volume of the atlas to the FA volume of each subject. Seeded from the registered ROIs, streamline tractography is performed in each subject's native image space. (Bottom) Trajectories from all 37 subjects are mapped back to the atlas space and are clustered into bundles based on their spatial proximity and shape similarity to the medial representation of fiber tracts in the atlas. Right panel: (Top) Trajectories are colored with the most probable label assigned in the clustering process. (Middle) Trajectories are colored with the FA values. (Bottom) The medial representation of each bundle is colored by the average FA of trajectories in each bundle summarizing the local variation of the diffusion parameter along that fiber bundle, thereby providing topographic parameter maps.

