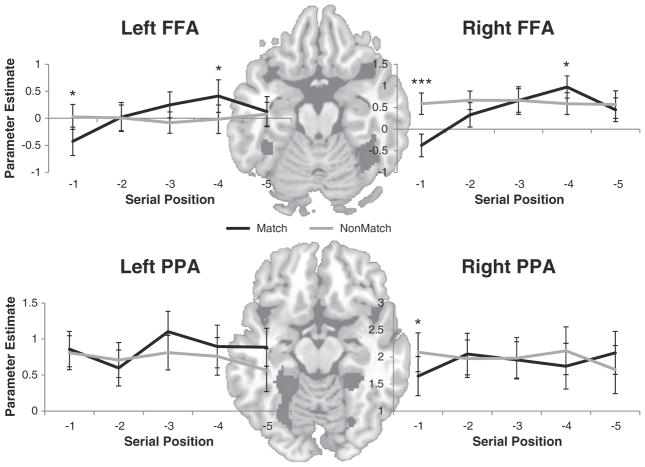
Fig. 5.
Results in object-selective areas. The underlays depict face- and place-selective voxels (black) from a representative subject. Top: group-averaged activations drawn from the left and right fusiform face areas (FFAs) as a function of serial position and probe-type. Bottom: group-averaged activations drawn from the right and left parahippocampal place areas (PPAs) as a function of serial position and probe-type. *p<0.05; **p<0.005; ***p<0.0005.

