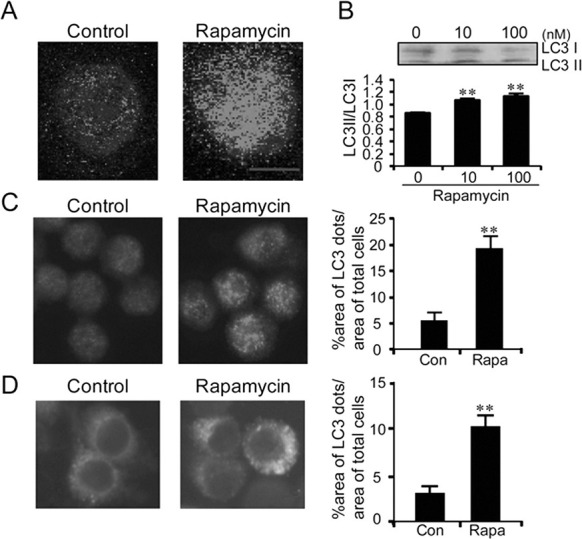
Fig. 1. Rapamycin treatment induced activation of the autophagy process in BV2 microglia cells. (A) Confocal microscopic images showing the formation of anti-LC-labeled dots in rapamycin-stimulated BV2 cells. Cells were treated with rapamycin (100 nM) for 6 h and were stained with anti-LC3 antibody. (B) Western blots showing rapamycin-dependent increase of the ratio of LC3-II/LC3-I and their quantified data. Western blot analysis was performed 6 h after treatment with rapamycin using anti-LC3 antibody. The concentration of rapamycin was 10 or 100 nM. The band intensity of LC3-II and LC3-I was measured by a densitometer. The graph represented the ratio of LC3-II/LC3-I. (C) Representative fluoresence microscopic images showing anti-LC3-labeled dots in BV2 cells before and after treatment with rapamycin (100 nM) and their quantified data. The percentage of total LC3-dot area per total cell area was quantified using by an image analysis program described in Materials and Methods. (D) Representative fluorescence microscopic images showing the distribution of GFP-LC3 in BV2-LC3 stable cells after treatment with rapamycin. The percent area of GFP-LC3 fluorescence dots per total cell area was quantified 6 h after treatment with rapamycin (100 nM). Data are presented as the means ± SEM. ** denotes difference between control cells and rapamycin treated cells at p<0.01. Scale bar; 10 μm.

