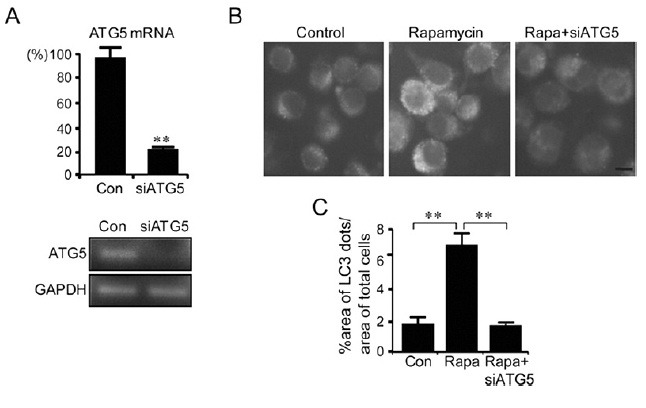
Fig. 2. Rapamycin-induced autophagy-like dots in BV2 cells were suppressed by siRNA-ATG5. (A) Real-time PCR data showing the inhibition of the ATG5 gene expression in BV2 cells transfected with siRNA-ATG5. The expression levels of ATG5 were examined 24 h after transfection with siRNA-ATG5. The PCR products were also visualized on agarose gel. (B, C) Representative fluorescence microscopic images showing GFP-LC3-labeled dots in control BV2-LC3-stable cells (Control), BV2-LC3-stable cells treated with rapamycin (100 nM), and BV2-LC3-stable cells treated with rapamycin and siRNA-ATG5 (Rapa+siATG5). siRNA-ATG5 was transfected 24 h prior to rapamycin treatment. Quantified areas of GFP-LC3-labeled dots are presented (C). The percent area of GFP-LC3 fluorescence dots was quantified 6 h after rapamycin treatment (100 nM). Data are presented as the means ± SEM. ** denotes difference between indicated groups at p<0.01.

