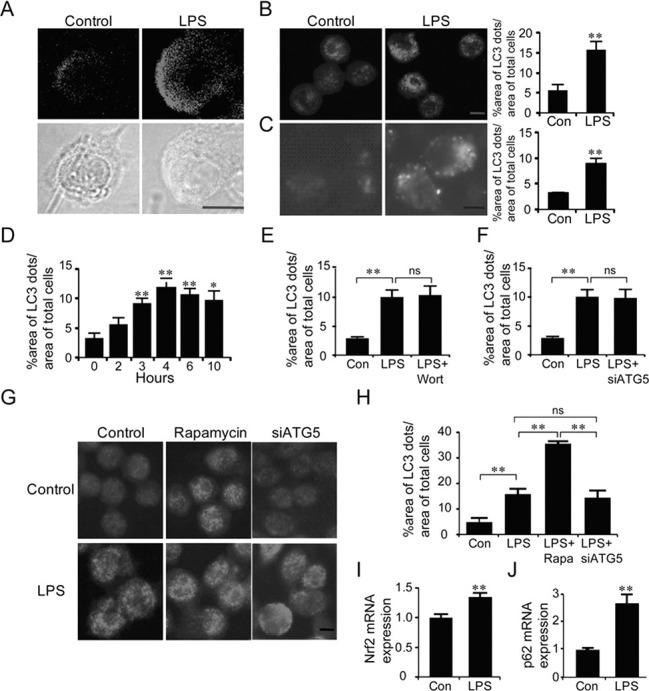
Fig. 3. LPS-induced activation of microglia expressed aggresome-like LC3-labeled dots. (A) Confocal microscopic immunofluosence images (top panels) showing anti-LC3-labeled dots in BV2 cells after stimulation with LPS. Anti-LC3 immunofluosence images were overlayed onto phase-contrast microscopic images (bottom panels). LPS (100 ng/ml) was treated for 6 h. (B) Representative fluoresence microscopic images showing anti-LC3-labeled dots in BV2 cells after treatment with LPS (100 ng/ml) and their quantified data. The total LC3-labled dot area per total cell area was quantified using by an image analysis program. (C) Representative fluorescence microscopic images showing the distribution of GFP-LC3-labeled dots in BV2-LC3 stable cells after treatment with LPS (100 ng/ml). The percent area of GFP-LC3 fluorescence dots was quantified 6 h after treatment with LPS. (D) Time-dependent increase and saturation in the formation of GFP-LC3-labeled dots in LPS-stimulated BV2-LC3 stable cells. Cells were incubated in LPS (100 ng/ml) for the indicated time. The percentage of total LC3-dot area was quantified with respect to total cell areas. (E, F) LPS-induced GFP-LC3-labeled dots in BV2-LC3 stable cells were not suppressed by siRNA-ATG5 (E) or wortmanin (F). siRNA-ATG5 was transfected 24 h prior to treatment of LPS or wortmanin. LPS (100 ng/ml) and wortmannin (200 nM) were treated for 6 h. The percentage of the LC3-dot area per total cell area is presented. (G, H) LPS and rapamycin independently increased GFP-LC3-labeled dots in BV2 cells treated with LPS, LPS+rapamycin, orLPS+siRNA-ATG5. LPS (100 ng/ml) or rapamycin (100 nM) was treated for 6 h. siRNA-ATG5 was transfected 24 h prior to treatment with LPS. (I-J) Real-time PCR data showing LPS-induced increase in the levels of Nrf2 (I) and p62 (J). LPS (100 ng/ml) was treated for 6 h and total RNA was harvested immediately after that. Data are presented as the means ± SEM. * and ** denote difference between indicated groups at p<0.05 and p<0.01, respectively. ns, no significant difference.

