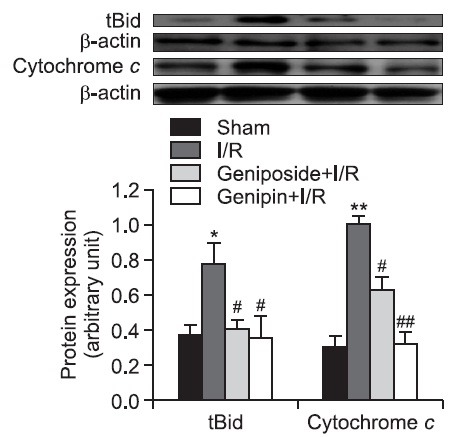
Fig. 4. Effects of geniposide and genipin on tBid and cytochrome c protein expression in hepatic I/R. Levels of tBid and cytosolic cytochrome c protein expressions were measured from liver tissues. The results are presented as mean ± S.E.M. of eight animals per group. Blots shown are representative of three experiments with similar results. *,**Denote significant differences (p<0.05, p<0.01) compared with the sham group. #,##Denote significant differences (p<0.05, p<0.01) compared with the I/R group.

