. 2013 Sep 3;2:e00726. doi: 10.7554/eLife.00726

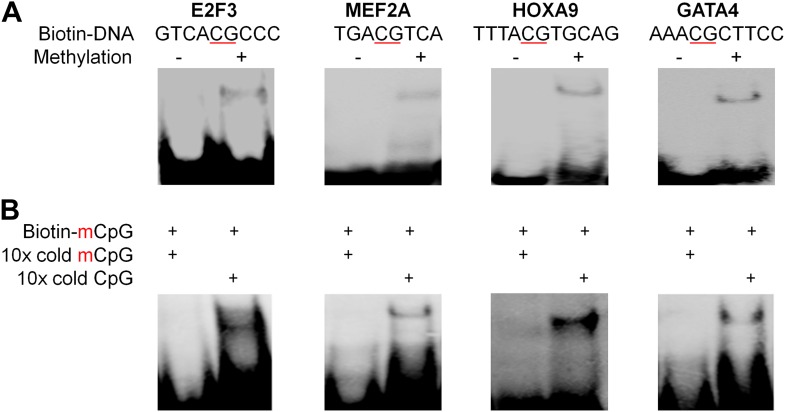
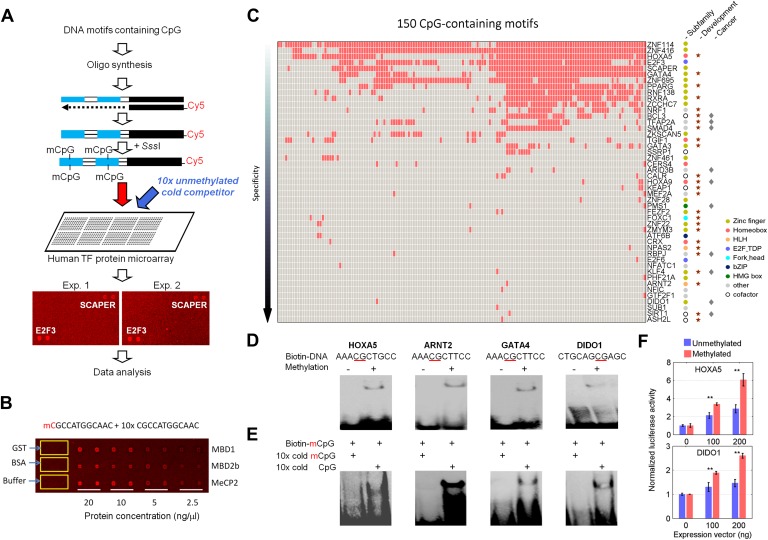
Figure 1. Protein microarray-based approach identified mCpG-dependent DNA-binding activity among human TFs and cofactors.

(A) A competition assay was used to identify proteins that preferentially bind to methylated DNA motifs. SCAPER (S-phase cyclin A-associated protein in the ER) and E2F3 (E2F transcription factor 3) were shown here as two examples of methylated DNA-binding proteins. (B) A proof-of-principle assay was conducted using known methylated DNA-binding proteins on a pilot protein microarray. (C) Binding profiles of 41 TFs and 6 co-factors against 150 of the 154 tested methylated DNA motifs are summarized in the interaction map. TFs are color-coded based on the subfamilies. (D) EMSA assays validated DNA-binding activity for four selected TF candidates. Representative images from three independent experiments with similar results are shown. (E) Competition EMSA assays confirmed mCpG-dependent DNA-binding activities. As expected, 10-fold unlabeled, methylated DNA motif readily abolished the protein–DNA complex formation of the tested TFs with the biotinylated and methylated DNA motifs (Lane 1 in each image). However, 10-fold cold unmethylated DNA counterparts could not compete off methylated DNA binding, consistent with the protein microarray results. (F) HOXA5 and DIDO1 showed mCpG-dependent activation of luciferase activity in GT1-7 cells. Values represent mean ± SD (n = 3; **: p<0.01; t-test).

DOI: http://dx.doi.org/10.7554/eLife.00726.003

Figure 1.

Figure 1—figure supplement 1. Data analysis of the protein microarray assays.

Figure 1—figure supplement 1.

(A) Workflow of data normalization. (B) Local normalization (window size 9 × 9). (C) Extrapolation of background noise distribution. Noise distribution of N2 is mirrored from distribution of N1. Standard deviation (SD) was calculated based on distribution N (Lower panel). (D) Distribution of Z scores of all proteins on a microarray. Z = 3 was selected as the cutoff in our study to identify the positives. The Z scores of some methylated DNA-binding proteins identified previously (Spruijt et al., 2013) are below our cutoff, while KLF4's Z score for one DNA motif is >6.

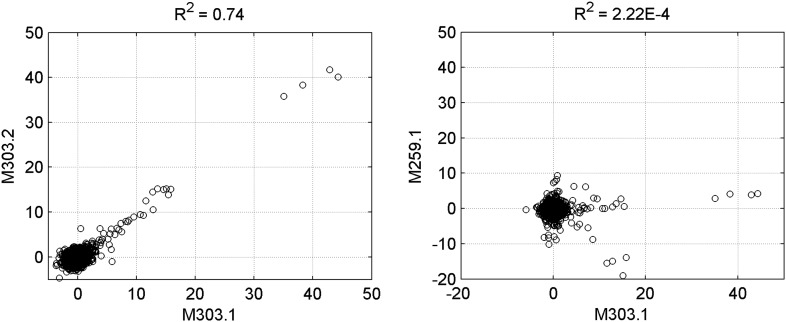
Figure 1—figure supplement 2. Reproducibility of protein microarray data.

Figure 1—figure supplement 2.

Left panel: signal comparison between a duplicated binding-assay with motif M303 shows a high correlation, confirming the reproducibility of the assay. Right panel: comparison between two random binding assays exhibited non-correlation between motifs M303 and M259.

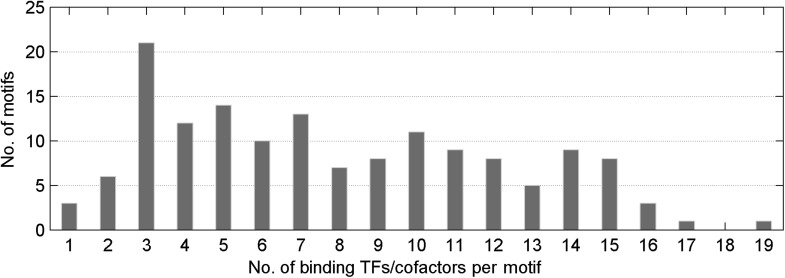
Figure 1—figure supplement 3. Distribution of number of mCpG-binding TFs/co-factors in a given motif-bind assay.

Figure 1—figure supplement 3.

The median value of TFs/cofactors binding to one methylated CpG-containing motif is 8.

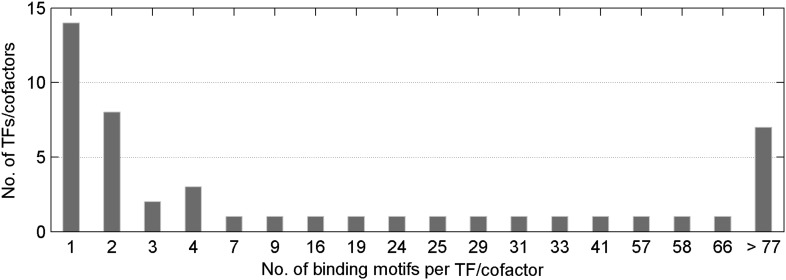
Figure 1—figure supplement 4. Distribution of number of methylated motifs recognized by a given TF/co-factor.

Figure 1—figure supplement 4.

Most TFs/cofactors bind to very few methylated DNA motif(s); whereas 7 TFs bind to more than 77 of the 154 motifs tested in this study.

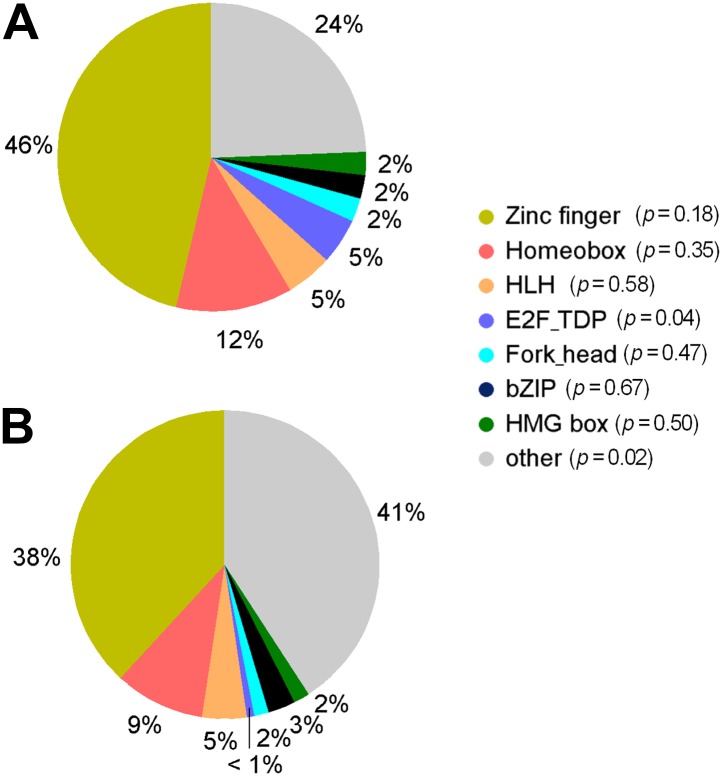
Figure 1—figure supplement 5. Distribution of TF subfamily members.

Figure 1—figure supplement 5.

(A) Distribution of TF subfamily members that showed mCpG-binding activity. (B) Distribution of all annotated TF subfamily members presented on the TF protein microarrays. Statistic analysis showed that none of the TF subfamilies was significantly enriched (p<0.01) for methylated motif-binding activities.

Figure 1—figure supplement 6. Four additional EMSA assays (A) and competition EMSA assays (B).

Figure 1—figure supplement 6.

The results confirmed specificity of mCpG-dependent DNA-binding activities.

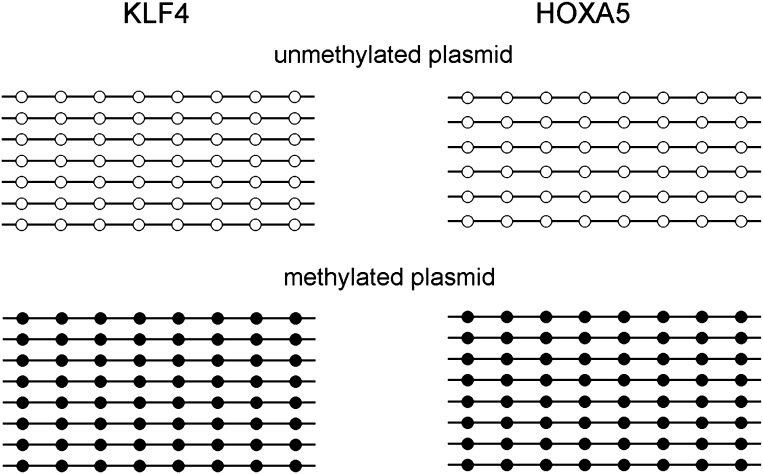
Figure 1—figure supplement 7. Methylation level of the KLF4 and HOXA5 luciferase reporter constructs.

Figure 1—figure supplement 7.

Eight units of KLF4 (TCCCGCCCA) and HOXA5 (AAACGCTGCC) binding motifs were separately cloned into the promoter region of a CpG-free luciferase reporter vector, and methylated with SssI before transfected into GT1-7 cells. Bisulfite sequencing confirmed that the CpG methylation levels of both motifs reached ∼100% after SssI treatment.

Figure 1—figure supplement 8. Number of unique mCpG-binding TFs/co-factors in function of number of tested methylated DNA motifs.

Figure 1—figure supplement 8.

The curve is far from saturation, suggesting that more such TFs/co-factors remain to be discovered.