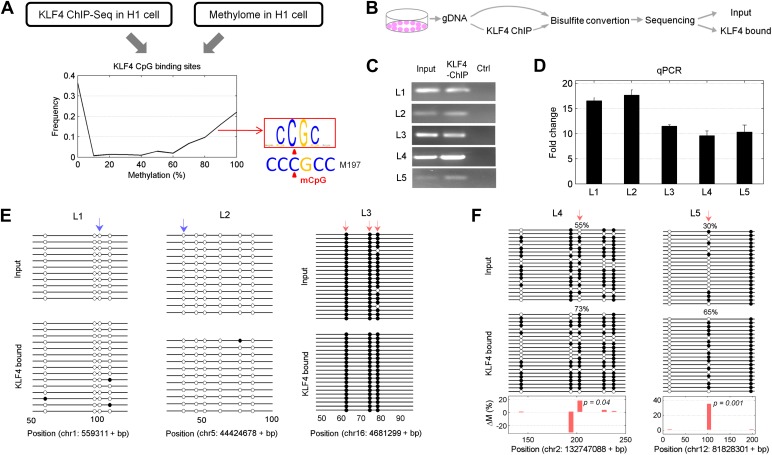
Figure 4. Endogenous KLF4 binds to methylated loci in human embryonic stem cells (H1) in vivo.
(A) Bioinformatics analysis to derive methylated DNA motif logo binding to KLF4 by integrating of KLF4 ChIP-Seq and methylome data in H1 cells. Based on the distribution of methylation level at the KLF4 binding sites, a top methylated consensus motif boxed in red was discovered in the highly methylated sites. As a comparison, M197 sequence recognized by KLF4 in the protein microarray assays is shown below. (B) Experimental procedure of KLF4 ChIP-bisulfite sequencing to confirm that KLF4 preferentially interacts with hyper-methylated motifs in H1 cells. (C) The gel images of KLF4 ChIP’ed loci (L1: chr1: 559311-559516; L2: chr5: 44424678-44424792; L3: chr16: 4681299-4681481; L4: chr2: 132747088-132747377; L5: chr12: 81828301-81828506) demonstrate specific and direct binding of KLF4 to its target regions. Negative controls were performed in the absence of the anti-KLF4 monoclonal antibodies. (D) Analysis of KLF4-ChIP against the five loci using the quantitative real-time PCR (qPCR) method. Fold change at each locus was obtained by taking the ratio of KLF4-ChIP qPCR signals over the negative control signals. Statistics analysis was based on three technical replicates. (E) Sanger bisulfite sequencing reads of input and KLF4-ChIP’ed DNA. Filled and blank circles indicate methylated and unmethylated CpG sites, respectively. Blue and red arrows indicate CpGs in the context of motifs M412 and M917, respectively. (F) For relatively lower methylation input, KLF4 methylated binding sites tend to have a higher methylation level after KLF4 ChIP. The lower panel in (F) shows the methylation differences at each CpG site between the input and KLF4 ChIP’ed DNA. p values were determined by binominal probability density function.


