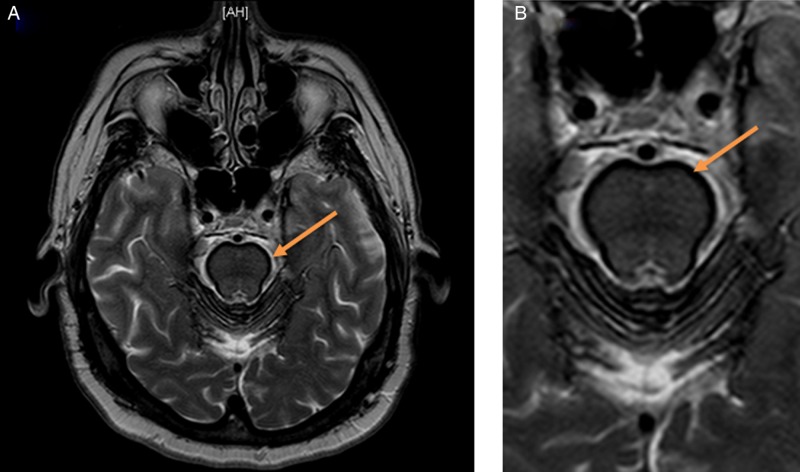
Figure 2.
An axial T2 with fat suppression (STIR) image through the brain at the level of the cerebellum (A and an enlargement of the cerebral peduncles and pons in B) demonstrating this thin dark layer of haemosiderin deposition along the cerebral peduncles and pons. Findings described above are highlighted by associated arrows.

