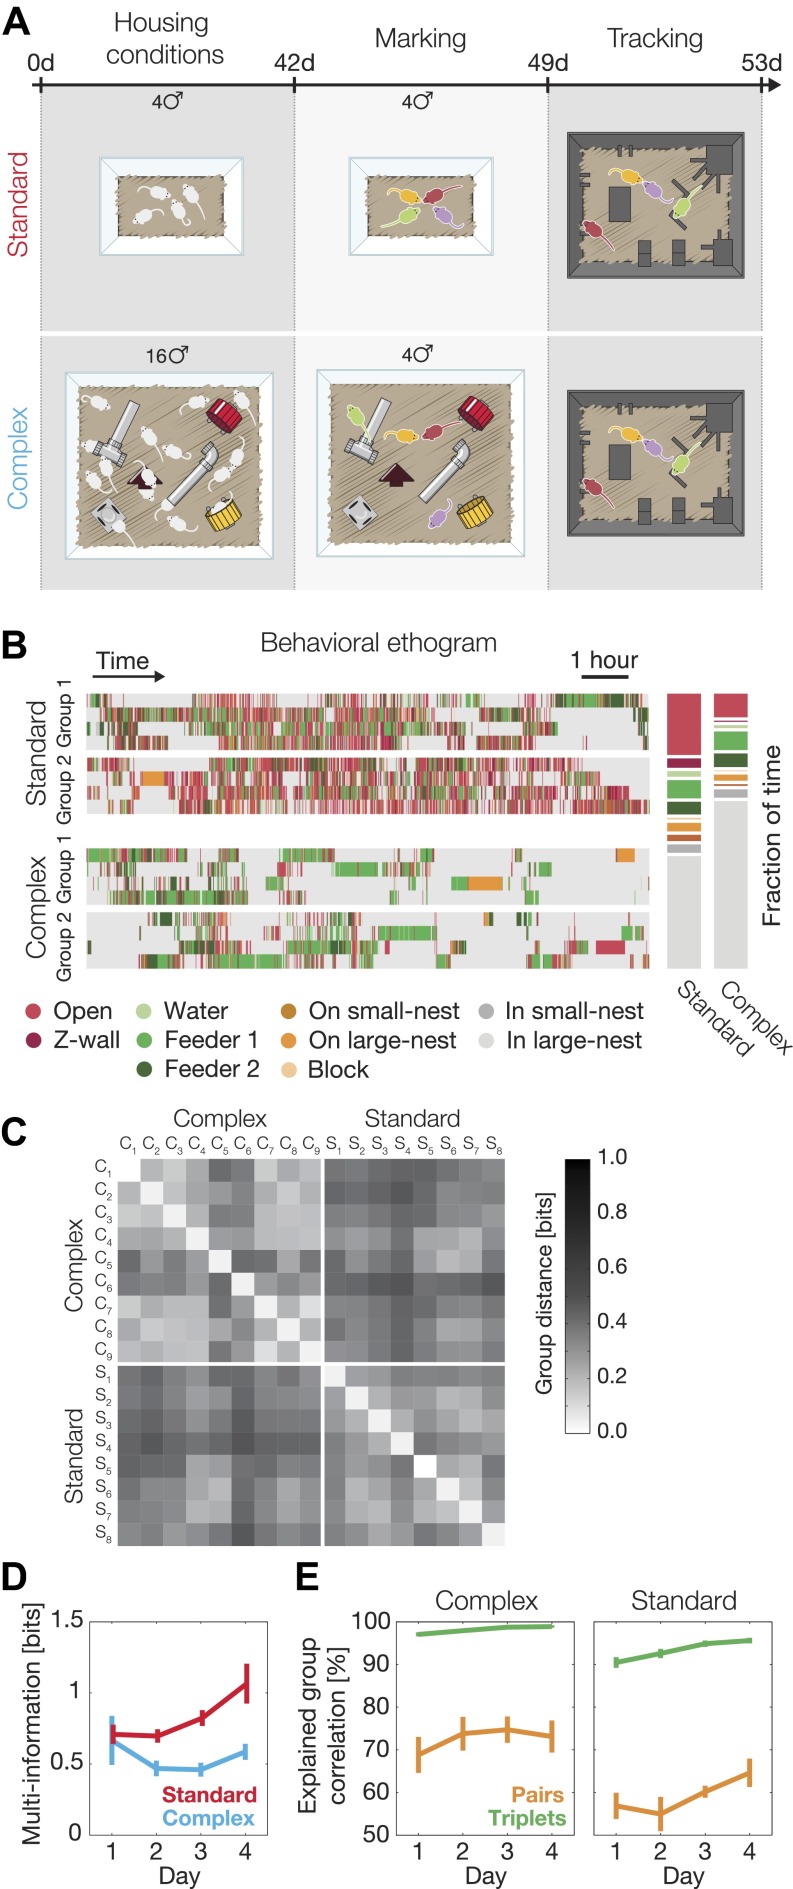
Figure 5. Environmental background changes group behavior and interactions.
(A) Experimental design. At the age of 4 weeks (day 0 of the experiment), mice were separated into two different housing conditions: standard environment and complex environment. After 6 weeks, groups of four mice from both treatments were color marked, returned to their cages for an additional week, and then put in the arena for recording their group social behavior. (B) Behavioral ethograms of two representative groups from each treatment (left). Data shown in these panels is for the 12 hr of the second day. Average percentage of time spent at the different regions over all groups for each treatment (right). (C) Similarity of group behavior between all SE and CE groups. For each pair of groups, the Jensen–Shannon divergence between the third-order maximum entropy models of the groups was calculated. Matrix entries are ordered by their corresponding SE or CE label. (D) Total group correlation (multi-information, IN) of the SE and the CE groups over 4 consecutive days. (E) The contribution of each order of interaction to the total correlation in the groups. Figure 5—figure supplement 1 presents the differences in the distribution of the fraction of information about the location of one mouse that can be ‘read’ from the location of the other mice for SE and CE groups.


