
Figure 3.
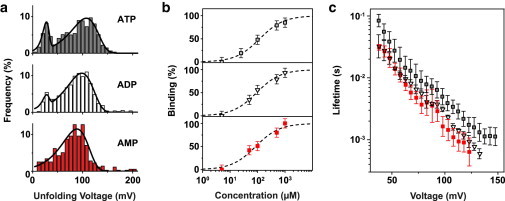
Aptamer target specificity. (a) Unfolding voltage distributions for adenosine mono-, di-, and triphosphate at a loading rate of 10 V/s. In all cases, a stable population assigned to target-bound structures is observed. Solid lines correspond to fits using Eq. 2. (b) Fraction of bound aptamer structures versus target concentration for ATP (open squares), ADP (open triangles), and AMP (filled squares). The dashed lines show fits to Eq. 4. The fit yields a dissociation constant of , , and for ATP, ADP, and AMP, respectively. (c) Voltage-dependent lifetime of aptamer–target complexes determined from measurement data according to Eq. 3. Error bars are standard deviations from 12, 4, and 6 independent measurements for ATP, ADP, and AMP, respectively.