
Figure 5.
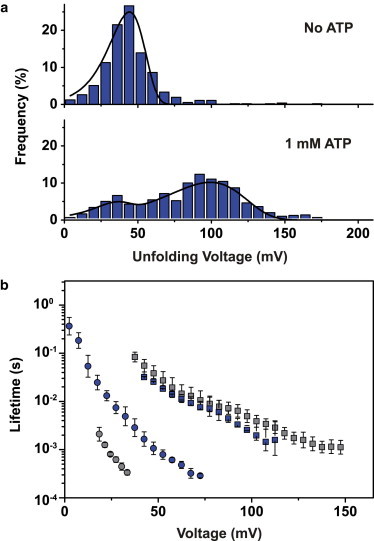
Aptamer tailoring. (a) Unfolding voltage distributions for the modified aptamer structure ATPapt-mod with and without addition of ATP at a loading rate of 10 V/s. Note the increase in critical unfolding voltage for the stabilized aptamer compared with the unmodified structure in Fig. 3. (b) Lifetime versus voltage for modified (blue) and unmodified (gray) aptamers (circles) and aptamer–target structures (squares). Error bars are standard deviations from 2 to 12 independent measurements.