
Figure 6.
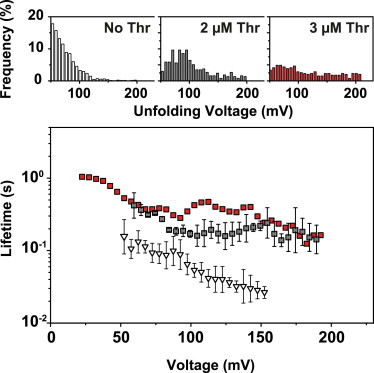
Unfolding of the thrombin aptamer. (Top panel) Typical unfolding voltage distributions without (open bars) and with (solid bars) addition of thrombin at different concentrations (gray: 2 μM, red: 3 μM). Experiments were performed at a loading rate of 0.2 V/s. (Bottom panel) Voltage-dependent lifetime of aptamer structures (open triangles) and aptamer–target complexes (solid squares, gray: 2 μM, red: 3 μM thrombin). Error bars are standard deviations from three independent measurements.