
Fig. 2.
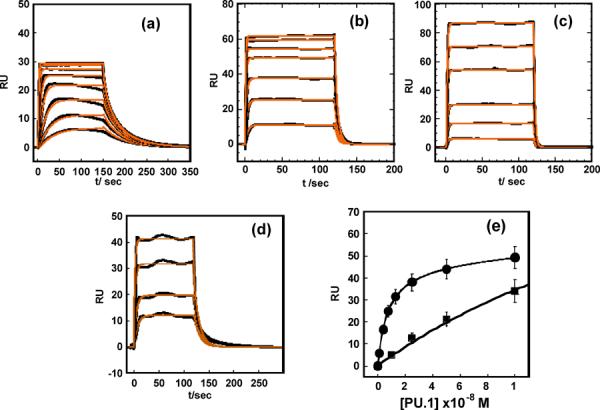
Kinetic and steady-state analysis of PU.1 ETS binding to the cognate λB site and non-cognate DNA by SPR. Sensorgrams for the λB site GGAA-1 in (a) 400Na (2, 4, 8, 15, 25, 50 and 75 nM PU.1 ETS from bottom to top), (b) 500Na (10, 25, 50, 100, 150, 200, 250 nM PU.1 ETS), (c) 600Na (10, 25, 50, 100, 150, 200, 250 nM PU.1 ETS) and (d) Sensorgrams for non-cognate DNA, AGAG at 400Na (10, 25, 50 and 100 nM PU.1 ETS from bottom to top). All the data were acquired at 25°C and pH 7.4 (e) Comparative binding isotherm from steady state analysis for (●) GGAA-1 and (∎) AGAG.